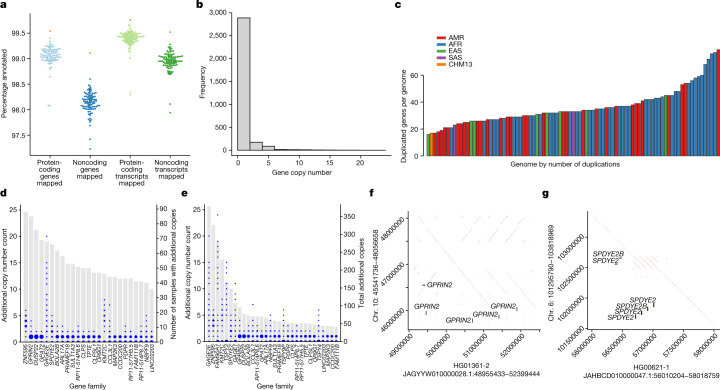
Fig. 2. Transcriptome annotation of the assemblies.
a, Ensembl mapping pipeline results. Percentages of protein-coding and noncoding genes and transcripts annotated from the reference set in each of the HPRC assemblies. Orange points represent T2T-CHM13 for comparison. b, Frequency of gene copy number. Individual genes may have separate copy number states among genomes, and the frequency reflects 3,210 observed copy number changes among the HPRC genomes. c, Number of distinct duplicated genes or gene families per phased assembly relative to the number of duplicated genes annotated in GRCh38 (n = 152). The GRCh38 gene duplications reflect families of duplicated genes, whereas the counts in other genomes reflect gene duplication polymorphisms. The assemblies are colour coded according to their population of origin. d, The top 25 most commonly CNV genes or gene families in the HPRC assemblies out of all 1,115 duplicated genes, ordered by the number of samples with additional copies relative to GRCh38. Grey bars, the number of samples with additional copies. Blue circles, the number of additional copies per sample, with the size of the circle proportional to the number of samples. e, The top 30 most individually copied CNV genes or gene families in the HPRC assemblies, ordered by total number of additional copies observed. Blue circles, the number of additional copies per sample. Grey bars, the total number of additional copies summed over the samples. f, Dotplot illustrating haplotype-resolved GPRIN2 gains in the HG01361 assembly relative to GRCh38. g, Dotplot illustrating SPDYE2–SPDYE2B haplotype resolved gains within a tandem duplication cluster of the HG00621 assembly relative to GRCh38.

