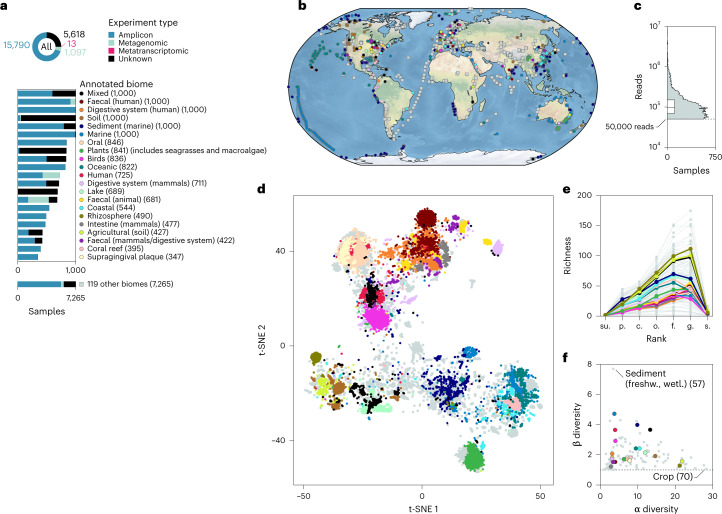
Fig. 1. A diverse and global microbial dataset.
a, Samples were received from vastly different annotated biomes and study designs. The numbers in parentheses indicate the number of samples within the annotated biome. Annotated biomes with fewer than 347 samples have been grouped as other. For a hierarchical tree of all annotated biomes, see Supplementary Fig. 1b. b, Geographical distribution of the samples. c, Total number of taxonomically annotated reads per sample (n = 22,518 samples). The box plot shows the interquartile range and median. No samples with fewer than 50,000 reads were selected. d, Samples from similar annotated biomes cluster together based on taxonomic profile in a t-SNE visualization (perplexity = 500), with the same ecological dissimilarity measure used as for SNB (namely, the Spearman’s rank correlation coefficient () of known taxa at taxonomic rank order). For a PCoA visualization of the same data and the positions of all 140 annotated biomes on the PCoA, see Supplementary Figs. 2 and 3, respectively. Most samples from the plants biome were derived from seagrasses and macroalgae from kelp forests. e, Taxa richness differs per annotated biome and taxonomic rank. The low number of annotated species is a consequence of a relatively unexplored biosphere. su., superkingdom; p., phylum; c., class; o., order; f., family; g., genus; s., species. f, Annotated biomes with high mean α diversity have low β diversity, whereas both low and high β diversity is found among annotated biomes with low mean α diversity. freshw., freshwater; wetl., wetlands.

