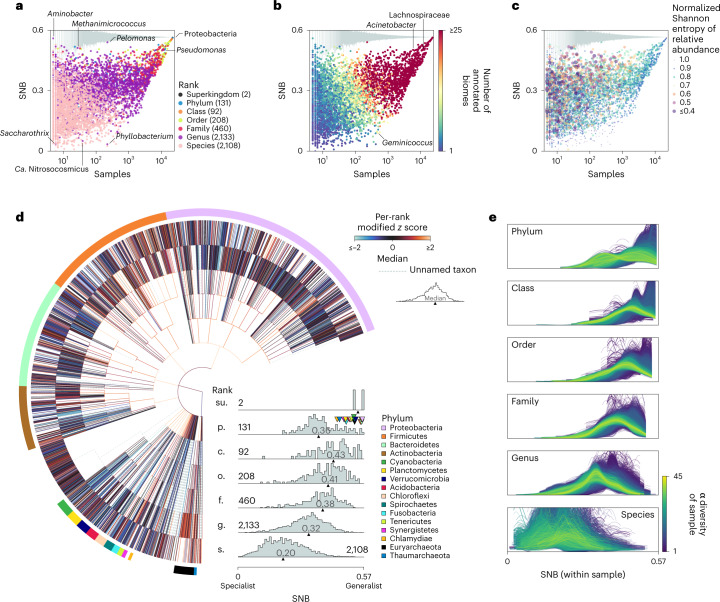
Fig. 2. SNB throughout the prokaryotic tree of life and across samples.
a–c, Relationship between SNB and the number of samples in which a taxon is found, coloured by rank (a), number of annotated biomes (b) and normalized Shannon entropy of relative abundance (c). The grey bars on top show the range of SNB scores of imaginary taxa that were present in 100 randomly picked subsets of samples of the specific size. The locations of some outlier taxa are indicated. Numbers within brackets indicate the number of taxa measured at each rank. The normalized Shannon entropy of relative abundance across samples is represented as shading for each taxon in c. Both colour coding and the size of the markers represent the Shannon entropy. Note that higher entropy is indicated with smaller markers. Relative abundance across samples was more constant for social specialists than for social generalists. Ca., Candidatus. d, SNB of taxa throughout the prokaryotic tree of life. SNB scores are standardized per rank based on the median absolute deviation (modified z scores), with low z scores representing taxa that are relatively specialist for their rank and high z scores representing taxa that are relatively generalist. The distributions of SNBs at different taxonomic ranks are shown as histograms, for which the numbers on the distributions show the number of taxa at that rank. The most diverse phyla are colour coded. e, Distribution of SNBs within samples at different taxonomic ranks. The α diversity of a sample was calculated on the rank order.

