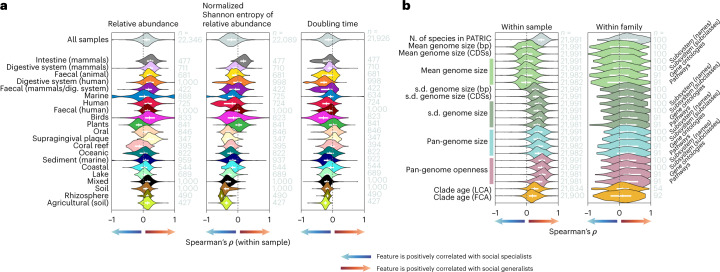
Fig. 3. Ecological and genomic features correlated with SNB.
a, Spearman’s rank correlation coefficient (ρ) within samples between SNB and features related to local dominance on the rank genus. The violin plots depict the distribution of ρ across all samples or those from the annotated biomes with the most samples. Annotated biomes are arranged according to mean α diversity. Positive values indicate that the feature is positively correlated with social generalists and negative values indicate that the feature is positively correlated with social specialists. Doubling time estimates are from the EGGO database. dig., digestive. b, ρ between SNB and genomic features in the PATRIC database on the rank genus within samples and within families. The violin plots depict the distribution of ρ across all samples and across all families with at least five genera. Genome sizes are given in base pairs (bp) and numbers of coding sequences (CDS). Genomic measures with annotations to the right are in numbers of unique functions for that specific functional universe. Genome size estimates for a genus are based on the genome size of its species, which is defined as the mean size of all strains for base pair and coding sequence measures, and as the majority set of functions of all strains for the functional universe measures. Pan-genome openness is the total pan-genome size divided by the mean genome size. Correlations with time to the last common ancestor (LCA) and first common ancestor (FCA) are based on the TimeTree database. Numbers to the right of violins show sample sizes. Lines within violin plots show the interquartile range and median. Supporting data are available in Supplementary Data 6 and 7. N., number; s.d., standard deviation.

