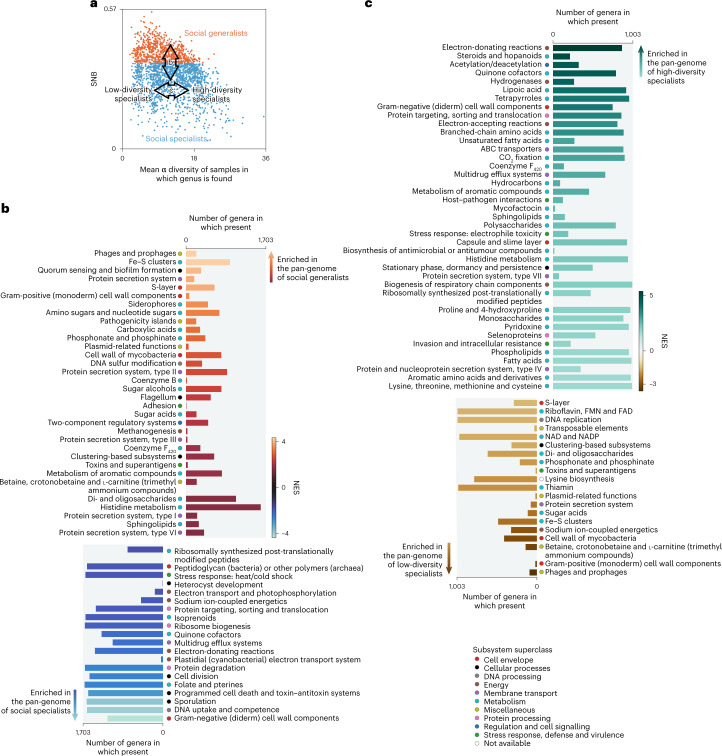
Fig. 5. Functional characterization of generalists and low- and high-diversity specialists.
a, Division of genera in social specialists (SNB < 0.35) and social generalists (other). Arrows represent the direction of the GSEA in panels b and c. b, GSEA on the pan-genome of all genera sorted by SNB, on the level of subsystem subclasses. c, GSEA on the pan-genome of specialist genera sorted by mean α diversity of the samples in which they are found, on the level of subsystem subclasses. Enriched functions (FDR < 0.1) in b and c are sorted according to normalized enrichment score (NES). The size of the bars indicates the total number of genera in the dataset having the function. The most enriched functions are in the upper and lower parts of the panels. Full GSEA information, including analyses of other functional universes (subsystem names, gene ontologies and pathways), is available in Supplementary Data 8 and 9.

