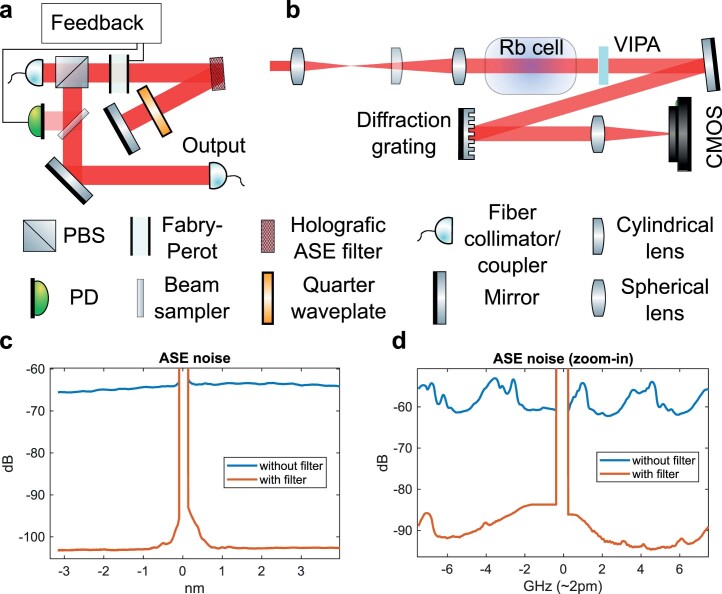
Extended Data Fig. 2. Characterization and filtering of Amplified Spontaneous Emission (ASE).
(a) Optical layout of the double-pass ASE filter. To stabilize the Fabry-Perot (FP) based filter over a long time a feedback-loop is realized via a photodiode, custom-written Arduino software and piezo that adjusts the FP mirror spacing. (b) Optical set-up used to measure the ASE (c,d) Plots of ASE spectrum with and without filter few nm (c) and few GHz (d) away from the laser line. The filter suppresses the total ASE (integrated over the whole measured range) by more than 40 dB. See Methods for further details.

