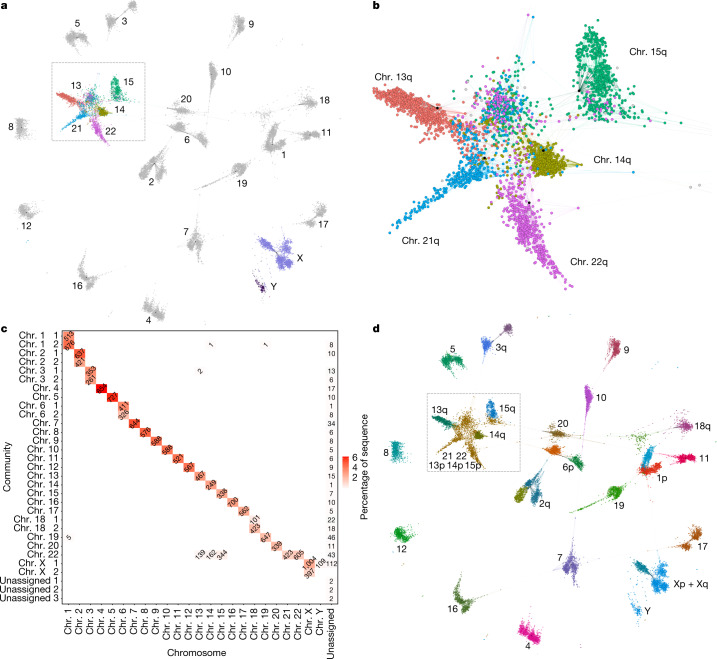
Fig. 1. Community detection in the HPRCy1 pangenome.
a, The reduced all-to-all mapping graph of HPRCy1 against itself, with contigs represented as nodes and mappings as edges. Colours distinguish the acrocentric or sex chromosome to which each contig was assigned by competitive mapping against T2T-CHM13 and GRCh38, with text labels indicating the chromosome for each visual cluster. b, A close-up view of the region indicated in a and d containing nearly all contigs that match acrocentric chromosomes. c, Results of community assignment on the mapping graph. The x-axis shows the chromosome to which contigs belong, based on competitive mapping to T2T-CHM13 and GRCh38; the y-axis indicates the community, which is named according to the chromosome that contributes the largest number of contigs to it. In the squares, the numbers indicate how many contigs belong each specific chromosome and community and the shade indicates the percentage of the total assembly sequence present in the set. The sex chromosomes and the acrocentric chromosomes participate in the only clusters that mix many (more than 100) contigs belonging to different chromosomes. d, The reduced homology mapping graph in a, coloured according to community assignment (colours do not correlate with those in a or b). The p-arms of chr. 13, chr. 14 and chr. 15, and all of chr. 21 and chr. 22 form one community, and chr. Y and most of chr. X form another.

