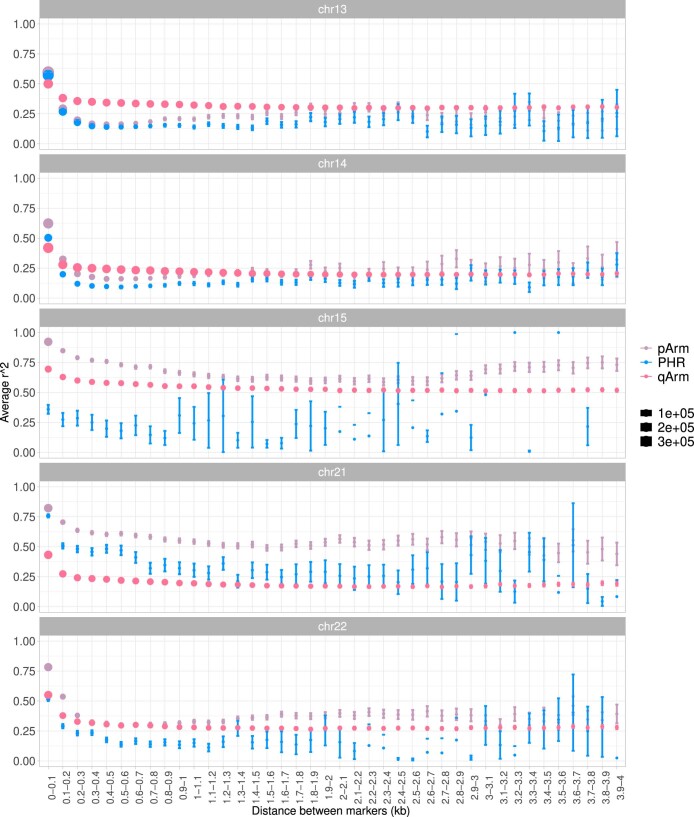
Extended Data Fig. 10. Linkage disequilibrium decay with distance between markers per acrocentric chromosome.
Each LD decay plot shows the p-arm (purple), q-arm (pink), and PHR (blue) mean r2 (points) and 95% confidence intervals (error bars) for marker pairs binned by the given inter-marker distance range (x-axis). Dot size is proportional to the number of pairwise comparisons within a bin. LD decay is faster in PHRs for chromosomes 13, 14, and 22. No notable LD decay is observed in PHRs for chromosome 15.

