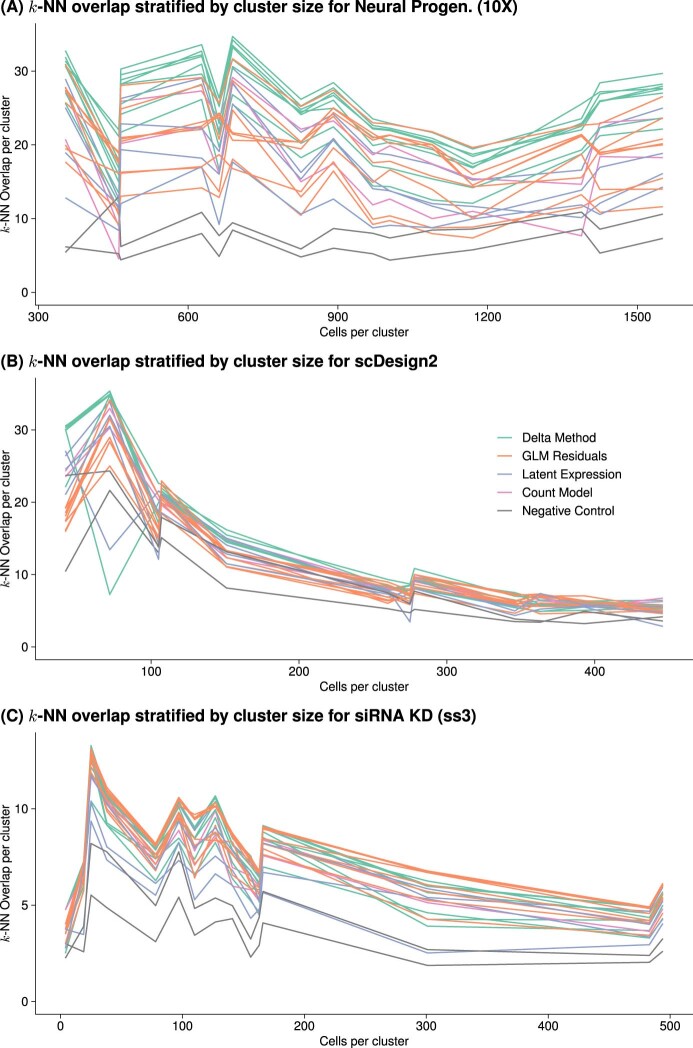
Extended Data Fig. 10. k-NN overlap as a function of cluster size.
The datasets were clustered using walktrap clustering. Extended Data Fig. 5 shows the cells colored by cluster assignment for all datasets. (A) k-NN overlap of the two halves of the human neural progenitor dataset stratified by cluster. (B) k-NN overlap with the ground truth for the scDesign2 simulation stratified by cluster. (C) k-NN overlap with the deeply sequenced data for the siRNA knockdown dataset stratified by cluster.

