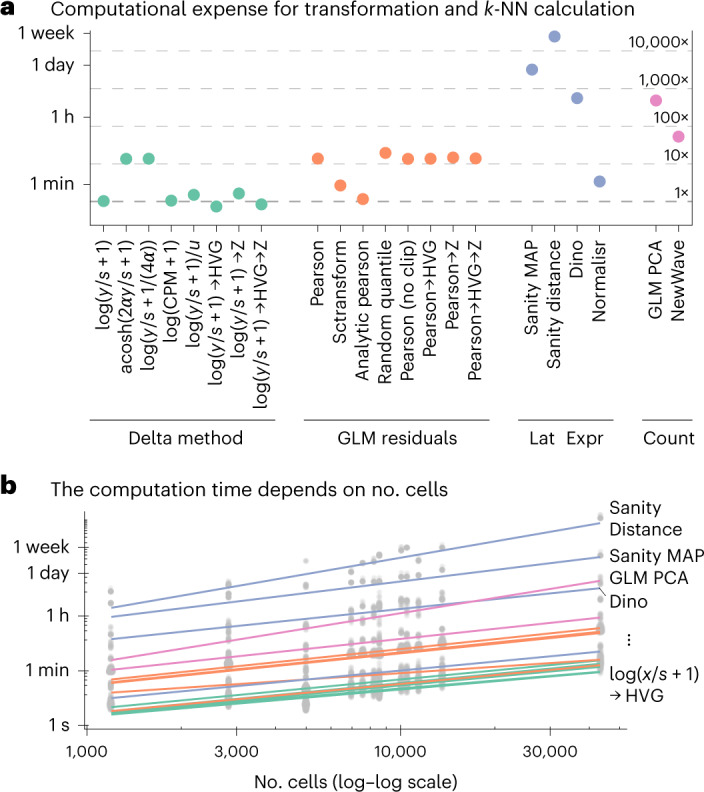
Fig. 3. Computational expense.

a, CPU time needed to calculate the transformation and identify the k-NNs for the 10x human helper T-cell dataset. The secondary axis shows the duration relative to the shifted logarithm. b, Dependence of run time on the number of cells, across datasets, shown on a double-logarithmic scale, with a linear fit. Most transformations have a slope of approximately 1 (scale linearly), whereas Sanity Distance and GLM PCA have a slope > 1.5, which indicates quadratic scaling. Source data are provided.
