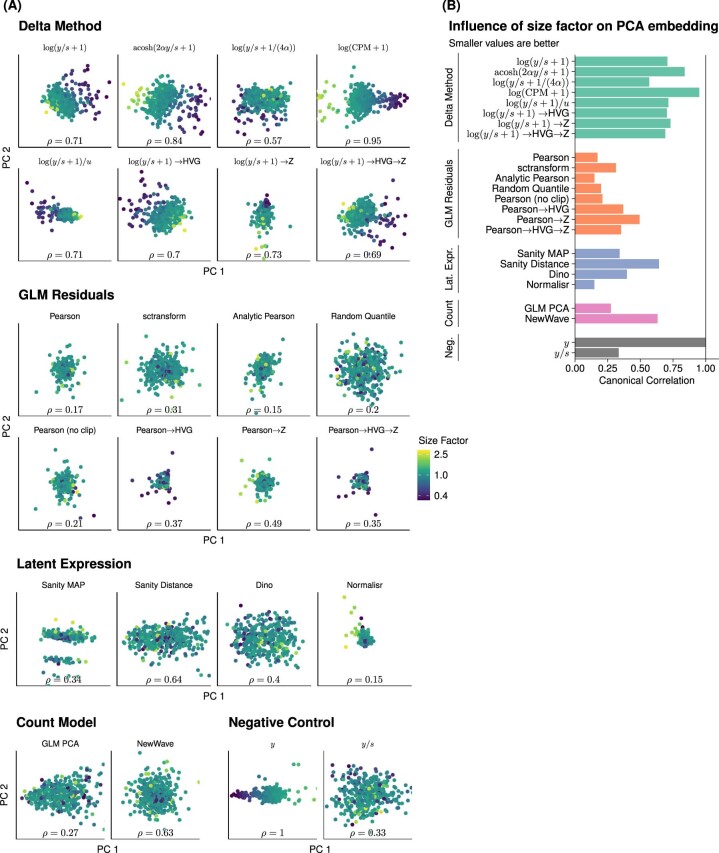
Extended Data Fig. 1. Confounding effect of size factors on PCA embedding of a homogeneous dataset.
(A) Scatter-plots of the first two principal components of the transformed data colored by the sequencing depth (expressed as a normalized size factor on a logarithmic scale) per cell. The data are from droplets that encapsulate a homogeneous RNA solution and thus the only variation is due to technical factors like sequencing depth21. The annotation at the bottom of the plot shows the canonical correlation coefficient ρ46 between the size factor and the first ten principal components. A lower canonical correlation that the variance-stabilizing transformation more successfully adjusts for the varying size factors; a canonical correlation of ρ = 1 means that the ordering of the cells along some direction in the first 10 PCs is entirely determined by the size factor. (B) Collection of the canonical correlations from the annotations of each panel in A displayed as a bar chart for easy visual comparison.

