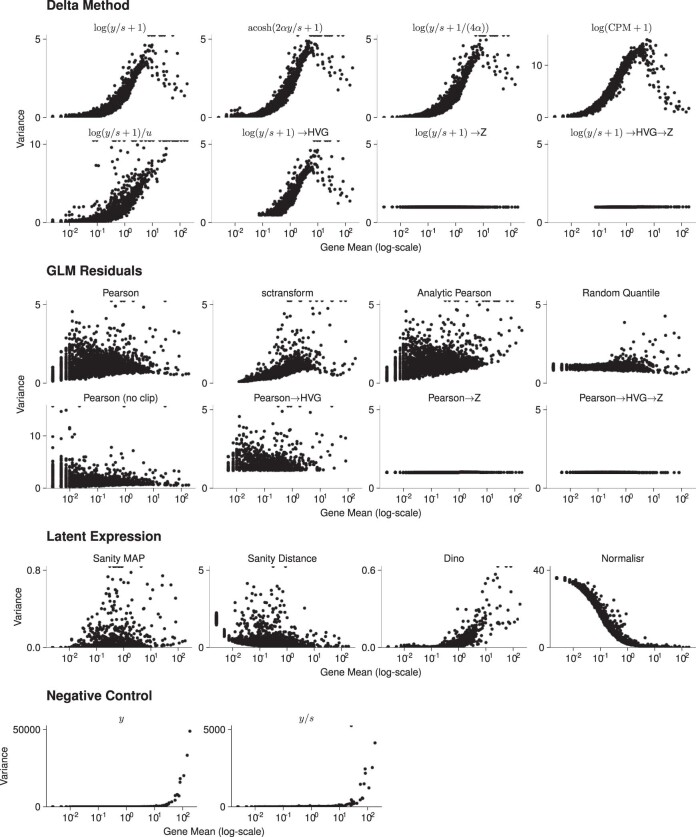
Extended Data Fig. 2. Mean-variance relations per gene for a 10x hematopoietic cell dataset.
Scatter-plots of the variance per gene after applying the variance-stabilizing transformation against the means of the 10x human hematopoietic cell dataset subset to 400 cells and 5000 genes. Note that the scale of the y axis differs for the raw counts, , , Pearson (no clip), Sanity MAP, Dino and Normalisr for esthetic purposes. Points that exceed the y axis scale are drawn on the top of each facet.

