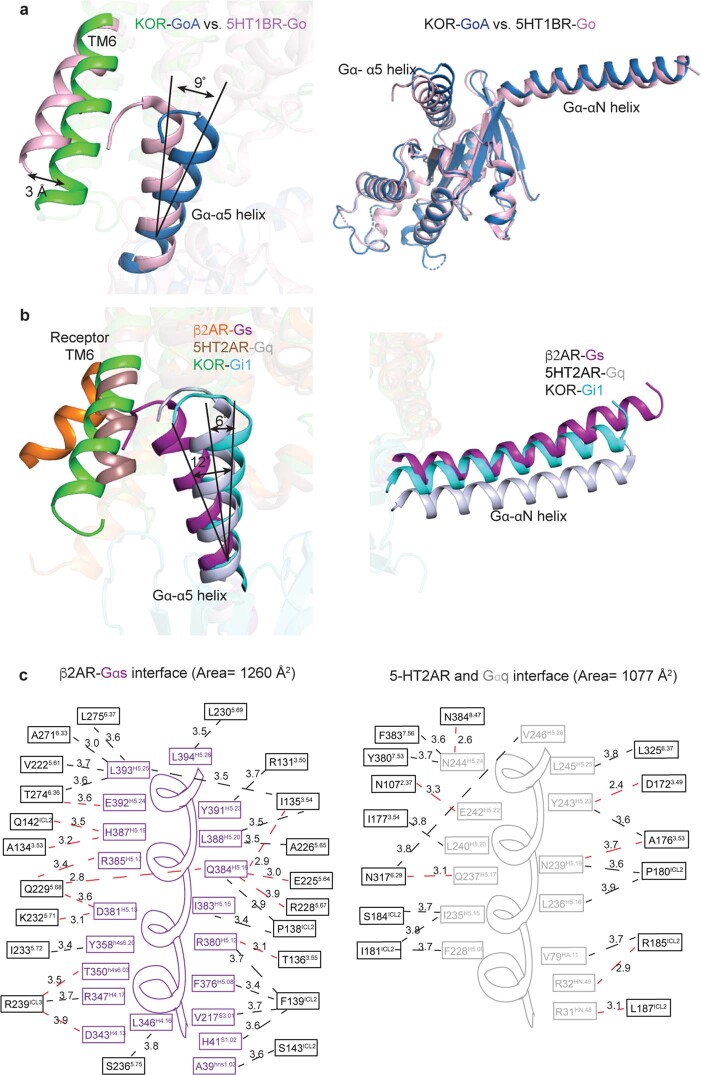
Extended Data Fig. 9. Comparison of KOR-coupled Gα subunit with other G protein families.
a. The KOR-GoA displays a different conformation from the 5-HT1BR-miniGo structure, including both TM6 of the receptor and α5 helix of the Gα subunit. b. Comparison of receptor-G protein interface among Gs, Gi1, Gq bound complexes. The TM6 of the receptor, αN and α5 helices of the Gα subunits adopt different conformations. c. The receptor-Gα interface of β2AR-Gαs and 5-HT2AR-Gαq. The dashed lines represent the closest distance between the intracellular receptor residues and the Gα residues. The distance cutoff is 4 Å. The interface area shown in the brackets was calculated by the online server PDBePISA.

