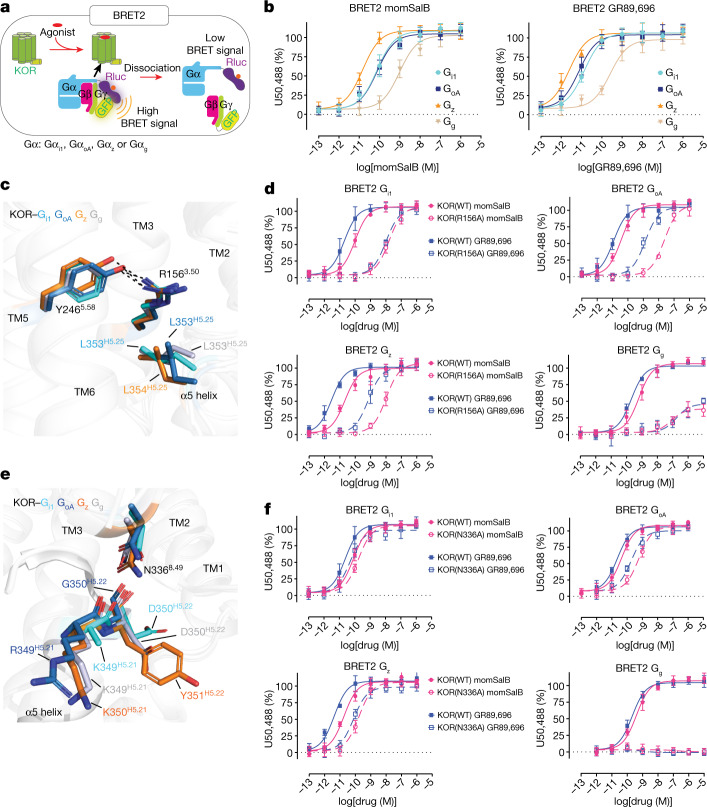
Fig. 3. Comparison of the receptor–G-protein-binding interface of the KOR–Gi1, KOR–GoA, KOR–Gz and KOR–Gg complexes.
a, Schematic of the BRET2 assay. b, momSalB- or GR89,696-mediated G-protein-subtype activation measured by BRET2. Data are grouped data ± s.e.m. of n = 4 biological replicates. The full quantification parameters for this experiment are provided in Supplementary Table 3. c, Interactions of Arg1563.50 in the Asp (D)-Arg (R)-Tyr (Y) motif with KOR and Gα. d, Mutagenesis analysis of Arg1563.50 by BRET2. Data are grouped data ± s.e.m. of n = 3 biological replicates. The full quantification parameters for this experiment are provided in Supplementary Table 4. e, Interactions of Asn3368.49 in different KOR–G-protein complexes. f, The N3368.49 A mutation differentially affects KOR-mediated G-protein subtype activation. Data are global fit of grouped data ± s.e.m. of n = 3 independent biological replicates. The full quantification parameters for this experiment are provided in Supplementary Table 4.

