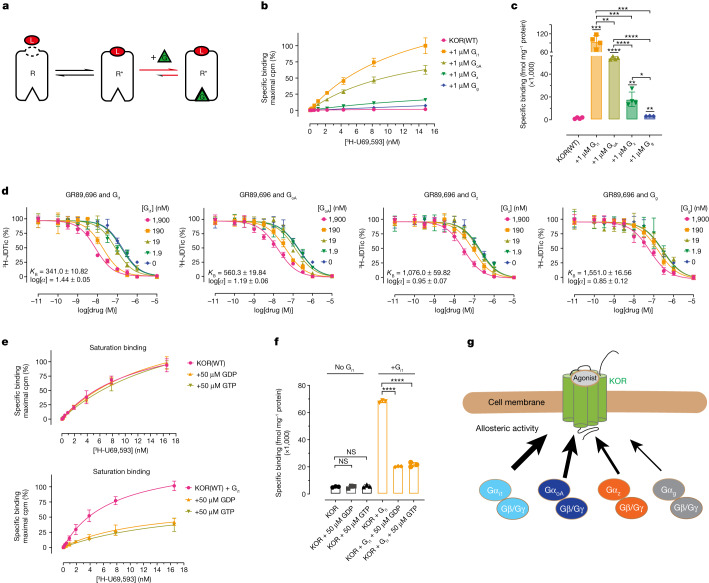
Fig. 4. The intrinsic differences of individual G-protein subtypes.
a, Schematic of the GPCR–G-protein–ligand ternary model. G, G protein; L, agonist; R, receptor. b, KOR saturation binding reveals that G proteins potentiate agonist binding with different amplitudes. Data are global fit of grouped data ± s.e.m. from n = 4 independent biological replicates. c, Summary of Bmax values in the presence of G proteins. Statistical analysis between groups was performed using the unpaired two-tailed Student’s t-tests; P = 0.0001 (KOR + Gi1 versus KOR), P = 0.0021 (KOR + Gz versus KOR), P = 0.0075 (KOR + Gg versus KOR), P = 0.0081 (KOR + Gi1 versus KOR + GoA), P = 0.0004 (KOR + Gi1 versus KOR + Gz), P = 0.0007 (KOR + Gi1 versus KOR + Gg) and P = 0.0116 (KOR + Gz versus KOR + Gg). d, Competition binding reveals that G proteins have a different binding affinity and allosteric activity on KOR. Data are global fit of grouped data ± s.e.m. of n = 3 independent biological replicates. e, The effect of GDP or GTP on the allosteric activity of G proteins. Data are global fit of grouped data ± s.e.m. of n = 3 independent biological replicates. f, Summary of Bmax values in the presence or absence of GDP/GTP. Statistical analysis was performed using unpaired two-tailed Student’s t-tests compared with the KOR or KOR + Gi1 group; P = 0.9874 (KOR + 50 μM GDP versus KOR), P = 0.4147 (KOR + 50 μM GTP versus KOR). g, A representative model of different allosteric activity of Gi/o family subtypes (Gi1 > GoA > Gz > Gg). The full quantification parameters for the experiments in b, d and e are provided in Supplementary Tables 5–7, respectively.

