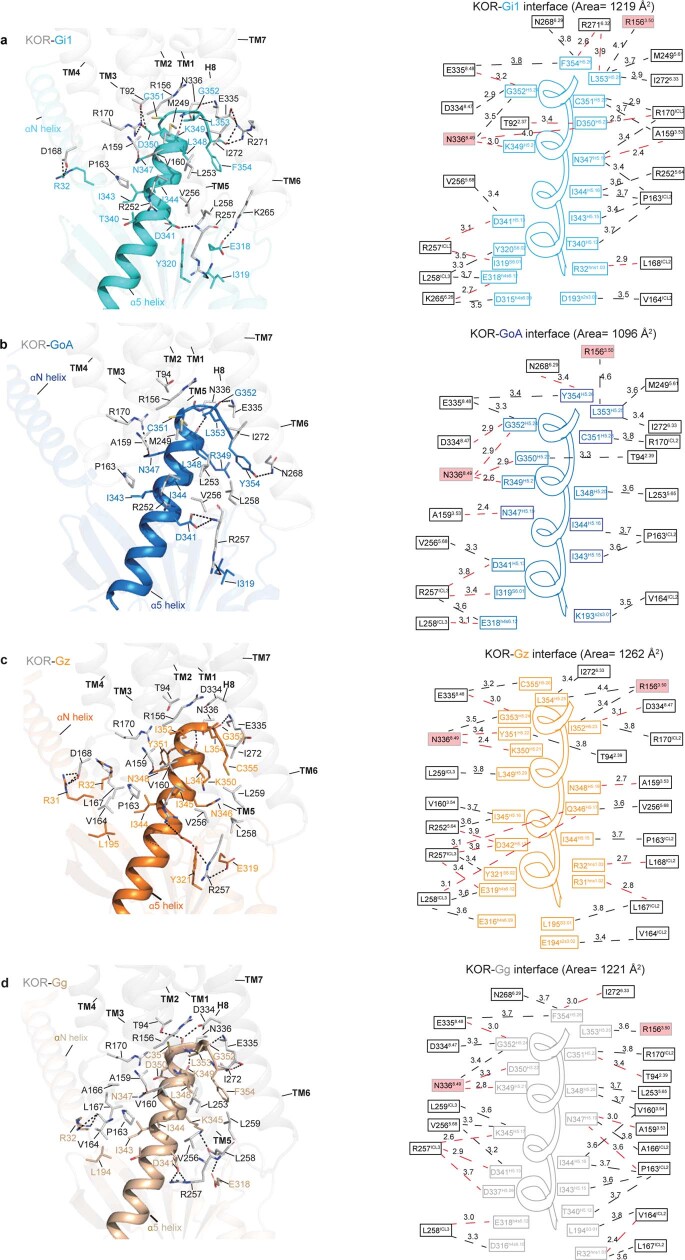
Extended Data Fig. 4. Comparison of interface details and areas between KOR and each G protein subtypes.
Specific interactions between the receptor and individual Gα subunits, Gi1 (a), GoA (b), Gz (c) and Gg (d). (Cartoon) Key residues from the intracellular side of KOR, and residues in the αN and α5 helix were mapped out. The H-bond or salt-bridge interactions are shown as red dashed lines. The closest distances between the intracellular KOR residues and the Gα residues were labelled. The distance cutoff is 4 Å. The interface area was calculated by the online server PDBePISA77.

