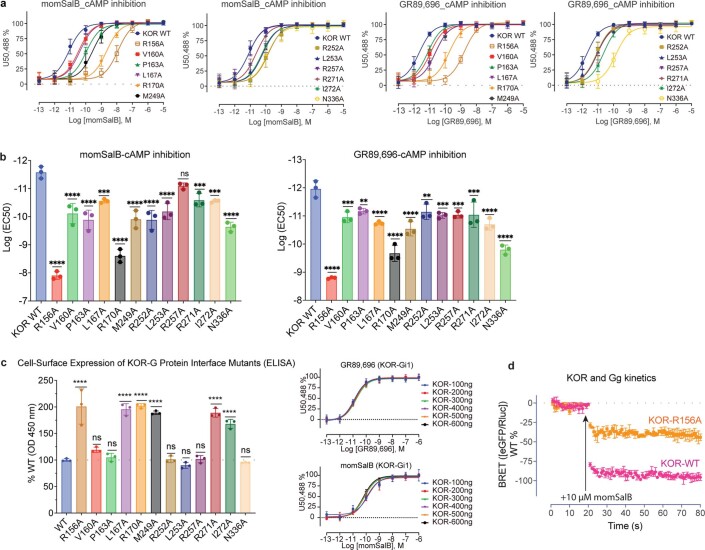
Extended data Fig. 5. The effect of KOR-G-protein interface residues on the G protein coupling.
a. Mutagenesis screening of KOR-G protein interface (KOR side) residues by cAMP inhibition assays. Data are grouped data ± s.e.m. from n = 3 biological replicates. b. Mutagenesis analysis of intracellular KOR residues by cAMP inhibition assays. Data are mean LogEC50 ± s.e.m. from n = 3 biological replicates. Statistical significance for each mutant is compared in a one-way analysis of variance (ANOVA) with Dunnett’s multiple comparisons test to the wild type (* = p < 0.05, ** = p < 0.01, *** = p < 0.001, **** = p < 0.0001, “ns” represents no significance, GR89,696: V160A: p = 0.0001, P163A: p = 0.0020, R252A: p = 0.0014, L253A: p = 0.0003, R257A: p = 0.0003, R271A: p = 0.0004; momSalB: L167A: p = 0.0003, R257A: p = 0.1514, R271A: p = 0.0004, I272A: p = 0.0002). Full quantitative parameters from this experiment are listed in Supplementary Table 12. c. Measurement of cell surface expression of KOR-G protein interface mutants by ELISA. The BRET results suggest a minor effect with different concentrations of KOR plasmids. Bar-graphs are OD450 ± s.e.m. from n = 3 independent biological replicates. Statistical significance for each mutant is compared in a one-way analysis of variance (ANOVA) with the Dunnett’s multiple comparisons test to the wild type (* = p < 0.05, ** = p<0.01, *** = p < 0.001, **** = p < 0.0001, “ns” represents no significance; V160A: p = 0.2732, P163A: p = 0.9992, R252A: p = 0.9998, L253A: p = 0.8943, R257A: p = 0.9997, N336A: p = 0.9992). Signalling curves are grouped data ± s.e.m. of n = 3 biological replicates. Full quantitative parameters from this experiment are listed in Supplementary Table 13. d. The KOR-R156A mediated decrease of efficacy was confirmed by the BRET2-based kinetic measurement. Data are net BRET ± s.e.m. from n = 3 independent biological replicates.

