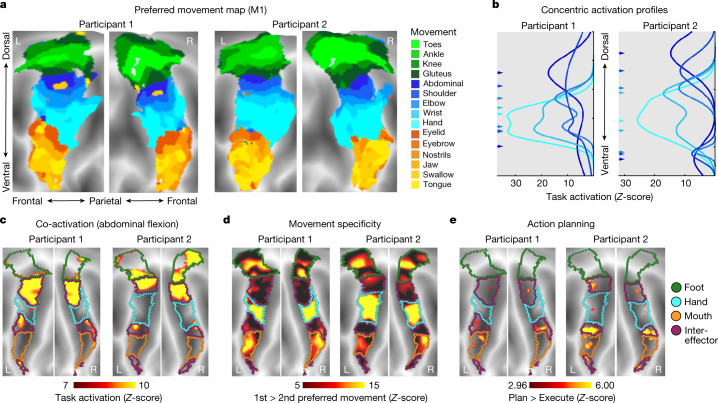
Fig. 3. Individual-specific task activations in M1.
a, Task fMRI activations (P1 and P2) during a movement task battery, including movement of the toes, ankles, knees, gluteus, abdominals, shoulders, elbows, hands, eyebrows, eyelids, tongue and swallowing (244 min per participant). Each cortical vertex is coloured according to the movement that elicited the strongest task activation (winner takes all) and is shown on a flattened representation of the cortical surface. Background shading indicates sulcal depths. b, Activation strength for each movement was computed along the dorsal–ventral axis within M1. A two-peak Gaussian curve was fitted to each movement activation (Methods). Fitted curves are shown for movement of abdominals, shoulder, elbow, wrist and hand. Peak locations (arrows on left) were arranged concentrically around the hand peak. See Extended Data Fig. 7 and Supplementary Fig. 4 for all movements. c, Inter-effector regions were co-activated during abdominal contraction. d, Inter-effector regions exhibited more generalized evoked activity during movements. Movement specificity was computed as the activation difference between the first- and second-most preferred movements for the six conditions that most activated each discrete region (toes, abdominal, hand, eyelid, tongue and swallowing). e, Event-related task fMRI data during an action planning task with separate planning and execution phases for movements of the hands and feet (Methods). M1 activity in the planning phase was higher than in the execution phase in the inter-effector but not the effector-specific regions.

