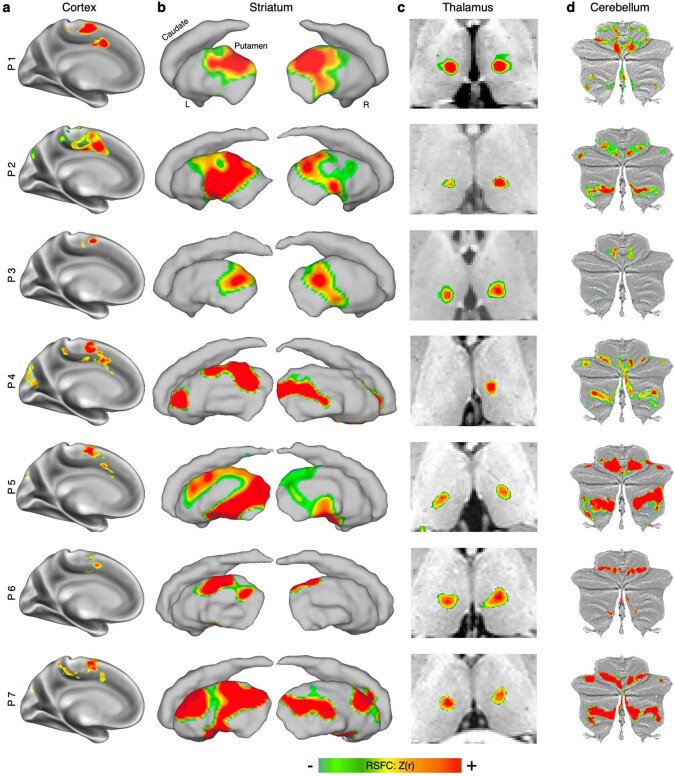
Extended Data Fig. 3. Whole brain functional connectivity of inter-effector motif across participants.
Brain regions with the strongest functional connectivity to the middle inter-effector region in a, medial cortex, b, striatum (lateral view of left and right striatum), c, thalamus (axial view), and d, cerebellum. Functional connectivity values are thresholded at Z(r) > 0.35 in cortex. Subcortical functional connectivity values are thresholded at different levels in each subject due to variation in subcortical signal-to-noise ratios across individuals. Thresholds were chosen to illustrate the strongest subcortical connections. Specific thresholds shown here: P1 - Z(r) > 0.15; P3, 4, 6, 7 - Z(r) > 0.1; P2 - Z(r) > 0.04; P5 - Z(r) > 0.03.

