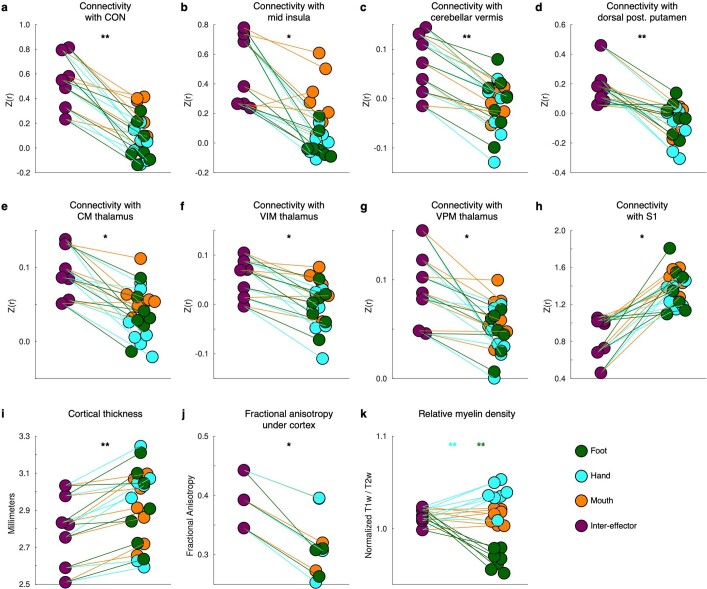
Extended Data Fig. 4. Functional connectivity and structural MRI metrics of motor cortex regions.
In each individual participant, measures derived from each of the foot, hand, mouth, and inter-effector motor regions. Colored lines connect the same participant’s inter-effector and effector-specific regions for ease of comparison. a, Functional connectivity strength Z(r) between M1 region and individual-specific Cingulo-Opercular Network (CON). b, Functional connectivity between M1 region and middle insula. c, Functional connectivity with Lobule VIIIa vermis of the cerebellum. d, Functional connectivity between M1 region and dorsal posterior putamen. e—g, Functional connectivity between M1 region and nuclei of the thalamus: e, Centromedian nucleus; f, Ventral Intermediate nucleus; g, Ventral Posteromedial nucleus. h, Functional connectivity between M1 region and adjacent postcentral gyrus (S1). i, Cortical thickness in M1 region. j, Fractional Anisotropy within 2 mm below cortex under M1 region. k, Intracortical myelin, indexed by the T1/T2 ratio and normalized across cortex, within cortex of M1 region. All significance values reflect significance across three two-sided paired t-tests (inter-effector vs foot, vs hand, and vs mouth). * P < 0.05; ** P < 0.01; *** P < 0.001, FDR-corrected.

