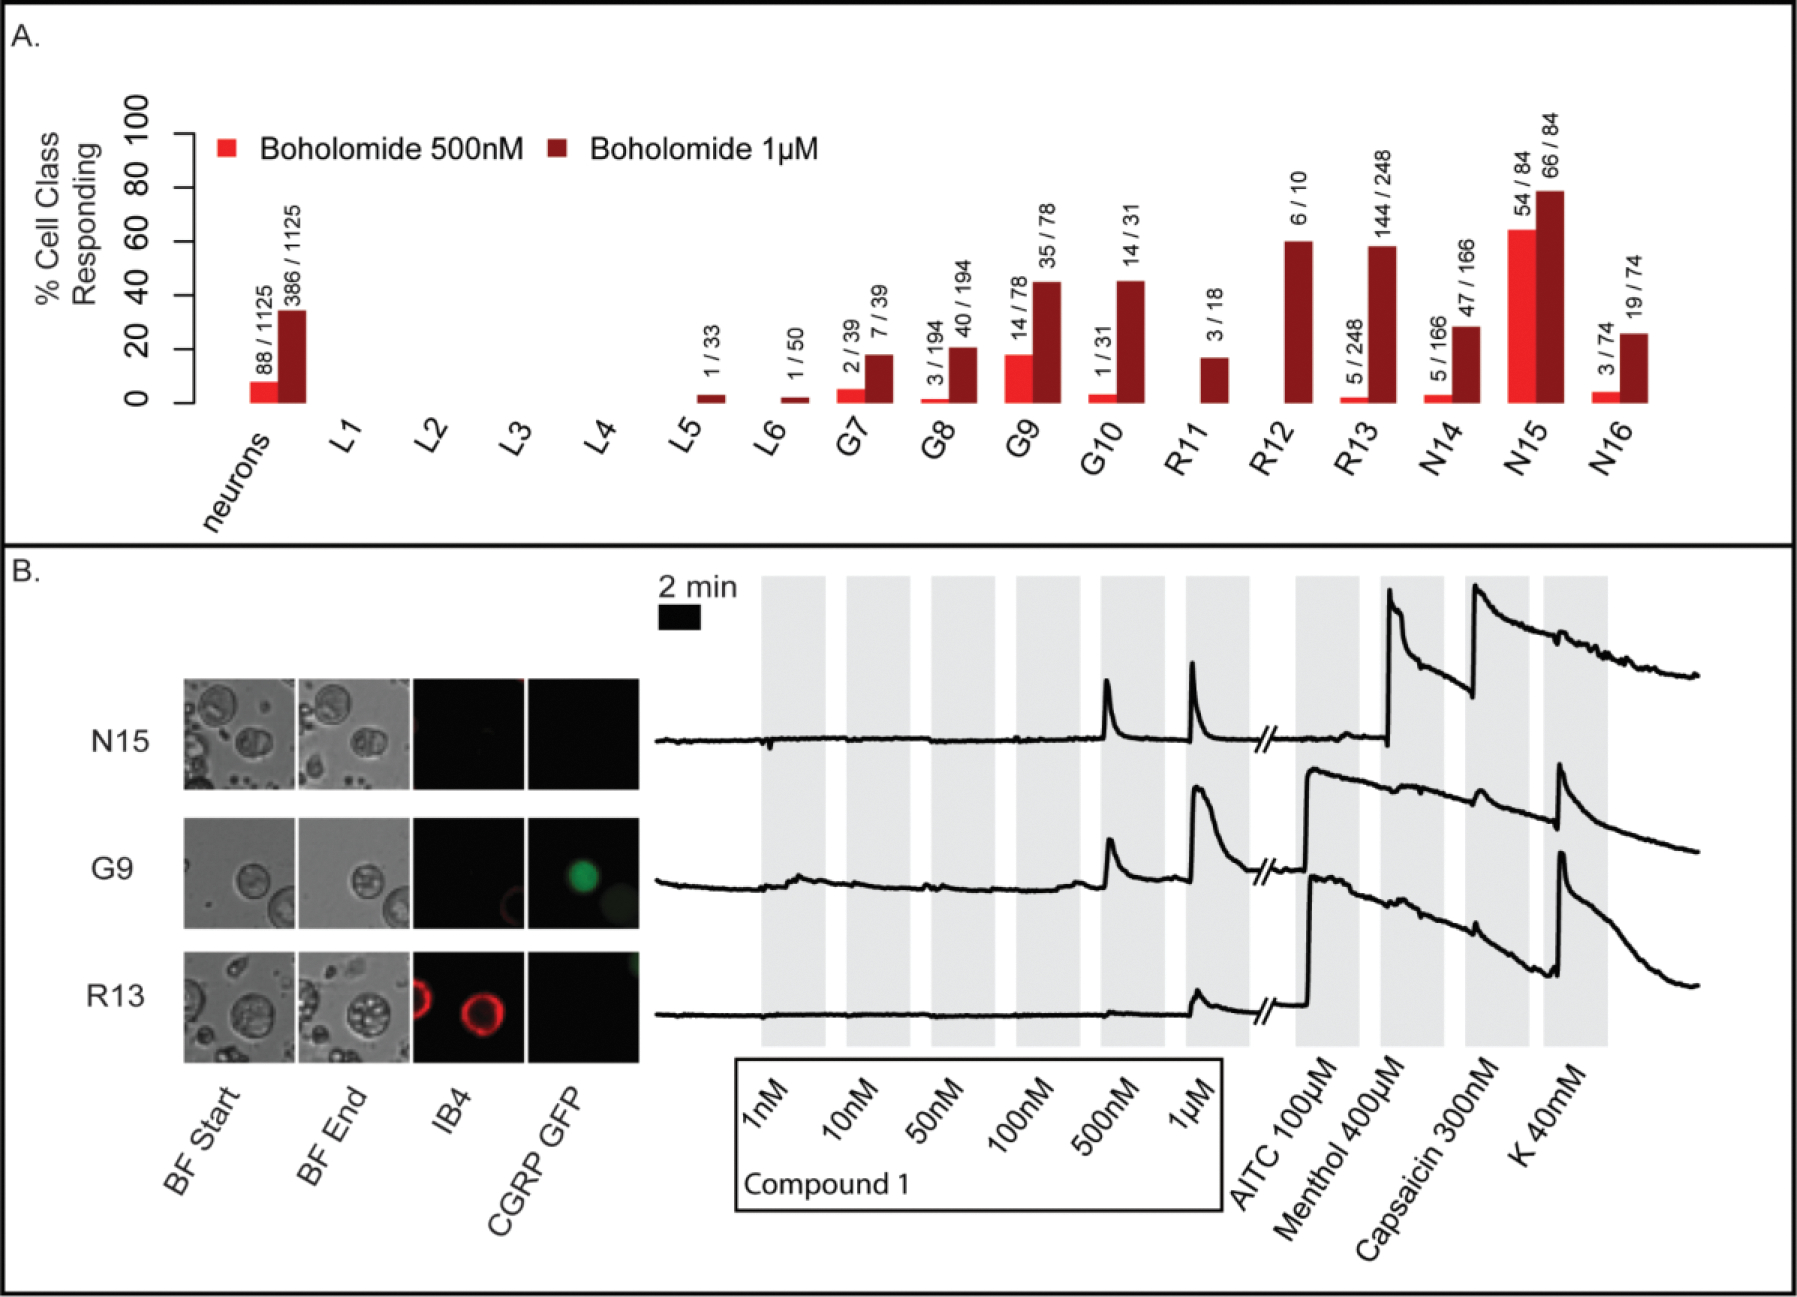
Figure 7.

DRG experiments using a 7-second pulse of boholamide A (1). (A) Summary of neurons affected in an experiment containing 1,125 individual cells. In the y-axis, the % of cells responding to boholamide (1) at 0.5 and 1 μM is shown, while the x-axis indicates the individual cell types affected. (B) The raw data underlying the experiment are shown. Three individual representative cells out of 1,125 total were selected. Cells are shown using bright-field (BF) microscopy at the start and end of the experiment. Small spheres within G9 and R13 are indicative of vesiculation. Fluorescent microscopy shows cells that are stained using IB4 antibodies or that express CGRP-GFP, differentiating cell types. To the right of the micrographs, a series of traces are shown representing fluorescence from Ca2+ entry into the cytoplasm. The y-axis represents relative fluorescence. On the x-axis, the individual treatments with reagents is shown. K = potassium chloride 40 mM.
