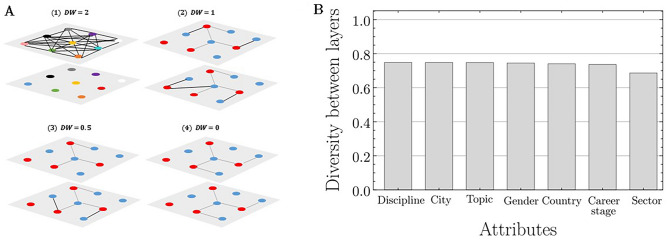
Figure 4.
The diversity between layers (i.e., project activities). (A) Conceptual representation of the diversity between layers (DB) measure using four examples. Each layer represents an activity, each node represents a person in the project (red = female, blue = male) and the edges (or connections between nodes) represent collaborations between people. (A.1) In the most extreme and special case, where two layers are maximally different , the nodes in one layer are completely disconnected (i.e., no collaborations exist for that activity), while the other layer is completely connected (i.e., every person is collaborating with every other person, and each person is different from every other person with respect to a given attribute (nodes are all different colors)). (A.2) Half of the diverse collaborations between people are unique (black edges) while the other half are the same in both activities (grey edges) . (A.3) Most of the diverse collaborations are the same in both activities (gray edges) and there are very few collaborations that are unique to one activity and not the other (black edges) . (A.4) The diversity between layers is zero , that is, all the diverse collaborations are the same in both activities (gray edges). (B) The global diversity between layers for each attribute in the SALURBAL network, ordered from highest to lowest diversity between layers. The global diversity score for each attribute was calculated by evaluating the diversity between every possible pair of project activities, for a given attribute, and then aggregating this information into a single score using the layer reduction method.

