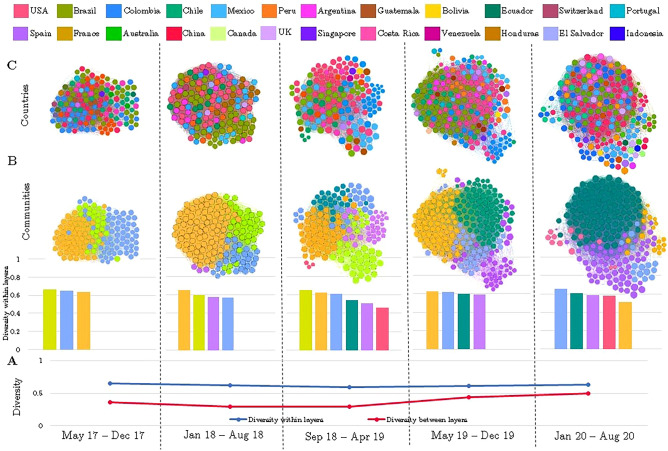
Figure 7.
SALURBAL collaboration network over time (2017–2020). Each node represents a project participant. Node size represents the diversity of the participant's collaborations, the smaller the node, the lower the diversity. (A) The average diversity within layers of all the SALURBAL activities vs the global diversity between layers over time. (B) Diversity within communities over time, where the node color represents the participant´s community. The communities are the groups of participants that are highly interconnected, as defined by the Louvain method, compared to the rest of participants. Each bar graph represents the community´s diversity by averaging across all attributes. (C) SALURBAL network where each node color represents the participant´s country.

