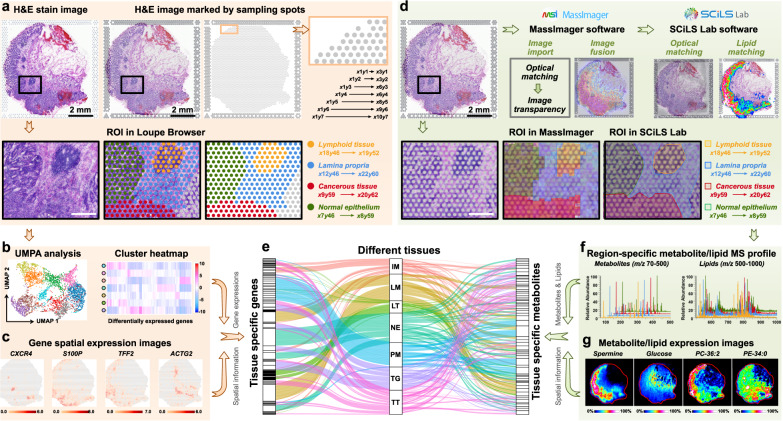
Fig. 2. The extraction of gene, lipid, and metabolite profiles in different tumor micro-regions.
a The process of extracting gene expression profiles in different tumor micro-regions of gastric cancer according to H&E stain image, scale bar = 2 mm for upper panels, scale bar = 500 μm for lower panels. The H&E stain experiment was repeated three times. b UMAP analysis and cluster heatmap of specifically expressed genes in different tumor micro-regions. c Spatial expression images of representative genes in gastric cancer tissue section (intensity in colour scale is log2 transformed). d The process of extracting metabolite and lipid profiles according to sampling spots-labeled H&E stain image, scale bar = 2 mm for upper panels, scale bar = 500 μm for lower panels. The H&E stain experiment was repeated three times. e Sankey diagram showing the distribution of marker genes and metabolites in different tissues. Each rectangle in the left represents a gene, each rectangle in the right represents a metabolite or lipid, each rectangle in the middle represents a tissue type, and the connection degree of each variable is showed based on the size of the rectangle. f Extracted region-specific metabolite and lipid profile. g MS images of representative metabolites and lipids in gastric cancer tissue section (intensity in colour scale is relative value). IM Intestinal metaplasia, LM Lamina propria, LT Lymphoid tissue, NE Normal epithelium, PM Peritumoral muscularis, TG Tumor and gland tissue, TT Tumor tissue.

