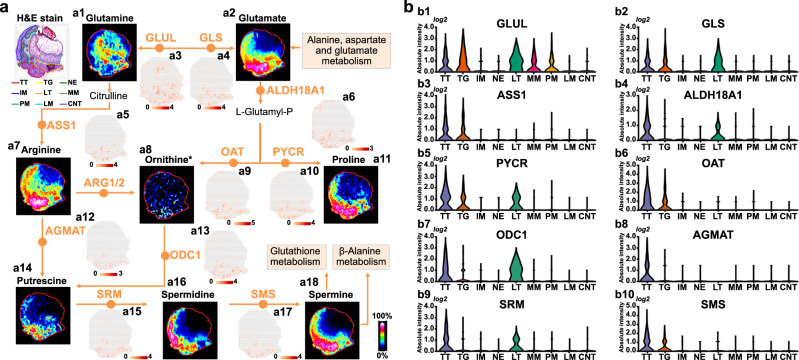
Fig. 3. Visualization of reprogrammed arginine and proline metabolism pathway in gastric cancer.
a MS images of key metabolites and spatial expression images of key genes in arginine and proline metabolism pathway (intensity in MS image colour scale is relative value, intensity in gene image colour scale is log2 transformed). b Violin plot show expression levels of key genes in arginine and proline metabolism pathway. *Ornithine only identified by high resolution MS spectrum. TT Tumor tissue, TG Tumor and gland tissue, NE Normal epithelium, IM Intestinal metaplasia, LT Lymphoid tissue, MM Muscularis mucosa, PM Peritumoral muscularis, LM Lamina propria, CNT Connective tissue.

