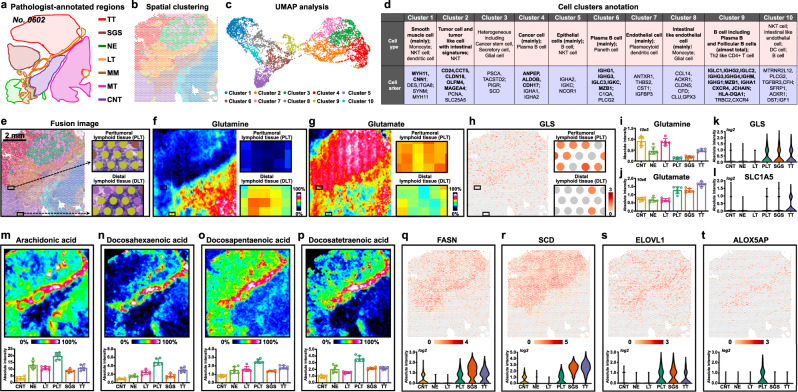
Fig. 6. Imaging the immunometabolic reprogramming in tumor interface region of gastric cancer.
a Pathologist-annotated regions of cancer tissue section from patient “No.0602”. b Visium array spots colored by graph-based clustering algorithm. c UMAP plot of gastric cancer tissue colored by clusters. d Cell cluster annotation of gastric cancer tissue. e The fusion image of visium array spots and H&E stain image, scale bar = 2 mm. The H&E stain experiment was repeated three times. f, g MS images of glutamine and glutamate in whole gastric cancer tissue section and in lymphoid tissue regions, intensity in colour scale is relative value. h Spatial expression images of GLS in whole gastric cancer tissue section and in lymphoid tissue regions, intensity in colour scale is log2 transformed. i–l Expression levels of glutamine, glutamate, GLS genes and SLC1A5 in different gastric cancer tissue section spots (seven tissue samples for spatial metabolomics, n = 6 independent section regions from patient “No.0602”, mean ± SD), p-values were calculated using the unpaired two-tailed t-test at confidence intervals 0.95. m–p MS images and expression levels of arachidonic acid, docosahexaenoic acid, docosapentaenoic acid, and docosatetraenoic acid in different gastric cancer tissue section spots (seven tissue samples for spatial lipidomics, n = 6 independent section regions per tissue sample, mean ± SD), intensity in colour scale is relative value. q–t Spatial images and expression levels of FASN, SCD, ELOVL1, and ALOX5AP in gastric cancer tissue, intensity in colour scale is log2 transformed. TT Tumor tissue, SGS Serrated glandular structure, NE Normal epithelium, LT Lymphoid tissue, PLT Peritumoral lymphoid tissue, MM Muscularis mucosa, MT Muscle tissue, CNT Connective tissue.

