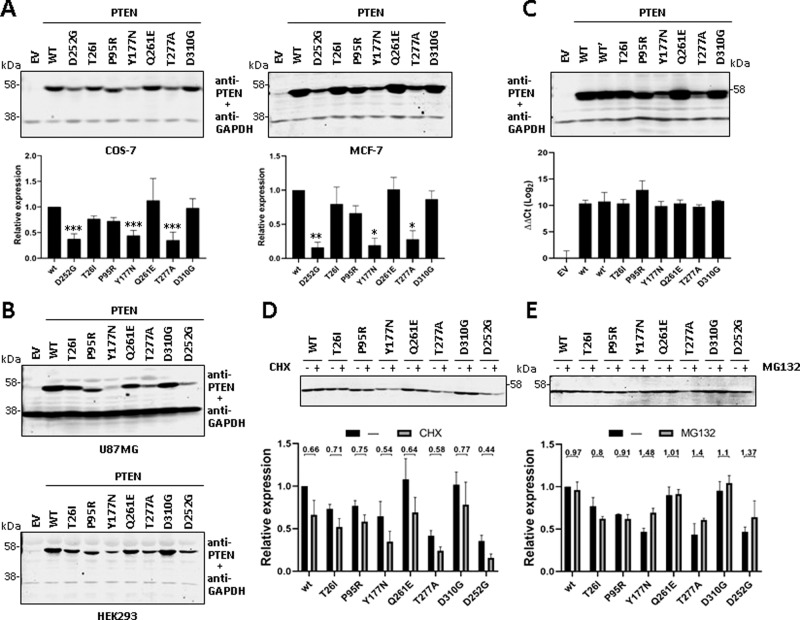
Fig. 2. Steady-state expression and stability of PTEN PHTS variants.
A COS-7 (left panel) or MCF-7 (right panel) cells were transfected with pRK5 plasmids encoding the indicated PTEN variants (EV empty vector, WT wild type), and cell lysates were resolved by SDS-PAGE 10% followed by sequential immunoblot using anti-PTEN 6H2.1 mAb and anti-GAPDH antibody. Top panels show representative experiments, and bottom panels show quantification of the PTEN bands from at least two independent experiments. Data are shown as relative expression with respect to PTEN wild type (wt = 1) ±SD. Statistical significance (Student’s t test P values) of the difference of some variants with respect to wild type is indicated with asterisks: ***p < 0.001, **p < 0.005, *p < 0.05. B U87MG (top panel) or HEK293 (bottom panel) cells were transfected and processed for immunoblot as in A. Representative experiments are shown. C COS-7 cells were transfected and processed for immunoblot as in A (top panel; note that PTEN wild type is duplicated [WT, WT’]) or were processed for RNA isolation and RT-qPCR (bottom panel). ΔΔCt values for PTEN amplification, using HPRT1 as the reference gene, are shown. D, E COS-7 cells were transfected as in A and kept untreated (−) or incubated (+) in the presence of cycloheximide (CHX, 800 μg/ml) or MG132 (10 μM) for 6 h to monitor protein degradation. Top panels show representative experiments, and bottom panels show quantification of the PTEN bands from two independent experiments. Data are shown as relative expression with respect to PTEN wild type under untreated conditions (wt = 1) ±SD. Numbers in the top indicate the ratio non-treate/treated for each variant. Note the inverted trends of variants Y177N and T277A in the presence CHX and MG132, in line with compromised stability.

