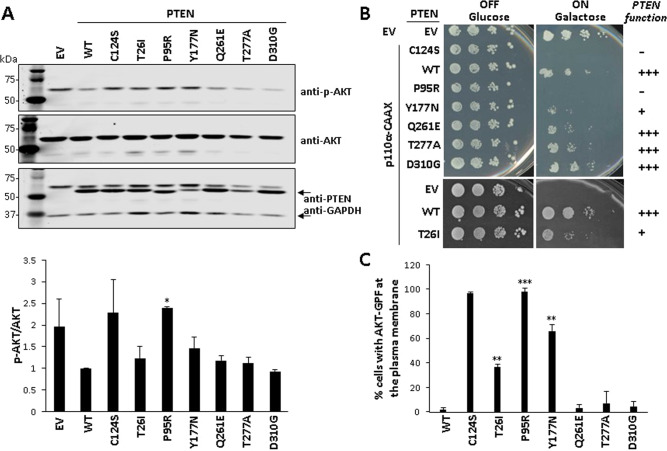
Fig. 3. PIP3-phosphatase functional activity of PTEN PHTS variants in cells.
A. Functional activity of PTEN variants in mammalian cells. COS-7 cells were co-transfected with different combinations of plasmids encoding AKT1 and PTEN variants (WT PTEN wild type, EV empty vector), and the phosphorylation of AKT (as an indirect measurement of PTEN PIP3-phosphatase activity) was monitored by immunoblotting using anti-pAKT (Ser473) antibody. The expression of total AKT, PTEN, and GAPDH (as a loading control) was also monitored using specific antibodies. In the top panel, a representative experiment is shown. In the bottom panel, the pAKT/AKT ratio from each condition is shown, after quantification of the bands from at least three independent experiments. Statistical significance (Student’s t test P values) of the difference of some variants with respect to wild type is indicated with asterisks: *p < 0.05. B Functional activity of PTEN variants in a heterologous yeast S. cerevisiae system by yeast growth drop assay. Cells were transformed with different combinations of plasmids encoding a hyperactive form of the mammalian PI3K p110α catalytic subunit (p110α-CAAX) and PTEN variants, under glucose growth conditions (OFF, no induction of heterologous proteins) or galactose growth conditions (ON induction of heterologous proteins). The growth of yeast cells is inhibited by p110α-CAAX (p110α-CAAX + EV [empty vector]), which converts essential pools of PIP2 into PIP3. This can be prevented by the expression of active PTEN (p110α-CAAX + PTEN wild type [WT]) but not catalytically inactive PTEN mutation (p110α-CAAX + PTEN C124S). −, no phosphatase activity; +, partial phosphatase activity; +++, phosphatase activity similar to PTEN WT. Bars correspond to the mean ± SD. C Functional activity of PTEN variants in a heterologous yeast S. cerevisiae system by microscopy monitoring using a GFP-AKT1 reporter. Cells were co-transformed with plasmids encoding a GFP-AKT1 reporter, which binds to PIP3 at the plasma membrane, and the PTEN variants. Removal of the GFP-AKT1 reporter form the plasma membrane is a read-out of PTEN activity on PI3K-generated PIP3 substrate. Data are the average of three experiments on three different clones (n > 100 cells per clone). Bars correspond to the mean ± SD. In the graphs from A and C, statistical significance (Student’s t test P values) of the difference of some variants with respect to wild type is indicated with asterisks: ***p < 0.001, **p < 0.005, *p < 0.05.

