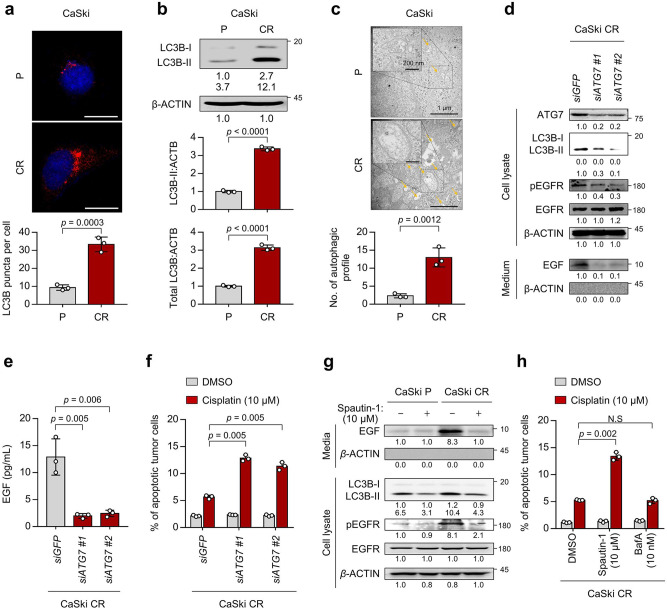
Fig. 2. Autophagy-mediated EGFR hyperactivation is required for cisplatin resistance.
a The cells were stained with anti-LC3B (red) antibodies and then visualized by confocal microscopy. DAPI was used to stain the nuclei. The images are representative of three separate experiments. Scale bar, 20 μm. The graph depicts the experimental quantitation of puncta. b The protein levels of LC3B were determined by western blot analysis. c CaSki P and CR cells starved for 24 hr in medium supplemented with 0.1% FBS were fixed and imaged by TEM. d–f CaSki CR cells were transfected with siRNA targeting GFP or ATG7. d The protein levels of secreted EGF and internal ATG7, LC3B, pEGFR, EGFR, and β-actin were confirmed by western blots. e The amount of EGF secreted into the media was measured by ELISA. f Flow cytometry analysis of the frequency of apoptotic (active caspase 3+) cells after incubation with or without cisplatin for 24 h. g In the cells treated with or without spautin-1, the protein levels of secreted EGF and internal LC3B, pEGFR, EGFR, and β-actin were determined by western blots. h Flow cytometry analysis of the frequency of apoptotic (active caspase 3+) cells after incubation with or without cisplatin for 24 h. b, c, g β-actin was used as the internal loading control. Numbers below the blot images indicate the expression as measured by fold-change. All experiments were performed in triplicate. The p values by two-tailed Student’s t test (a–c), one-way ANOVA (e), or two-way ANOVA (f, h) are indicated. The data represent the mean ± SD. Source data are provided as a Source Data file. (NS, not significant).

