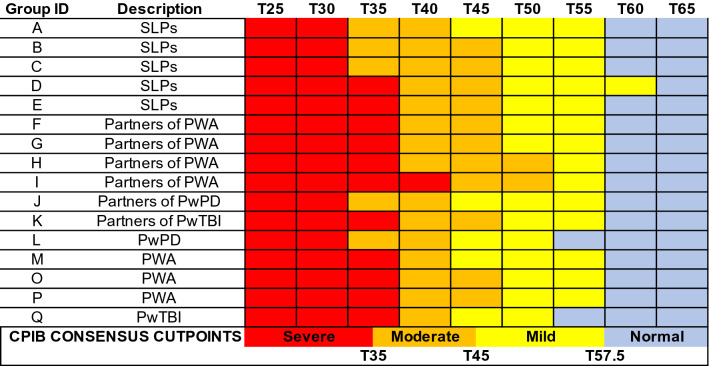
Fig. 3.
Cut points for the Communicative Participation Item Bank. CPIB = Communicative Participation Item Bank. Vignettes are shown by their associated T score (M = 50, SD = 10), where a T score equal to 50 matches the mean of that measure’s reference sample. For the CPIB, that reference sample is 701 individuals with multiple sclerosis, Parkinson’s disease, amyotrophic lateral sclerosis, and head and neck cancer. Each colored cell represents how each group classified each vignette (e.g., the T25 vignette, the T30 vignette)—within normal limits (blue), mild (yellow), moderate (orange), or severe (red). The synthesized cut points, determined by the adjudicating expert panel, are at the bottom

