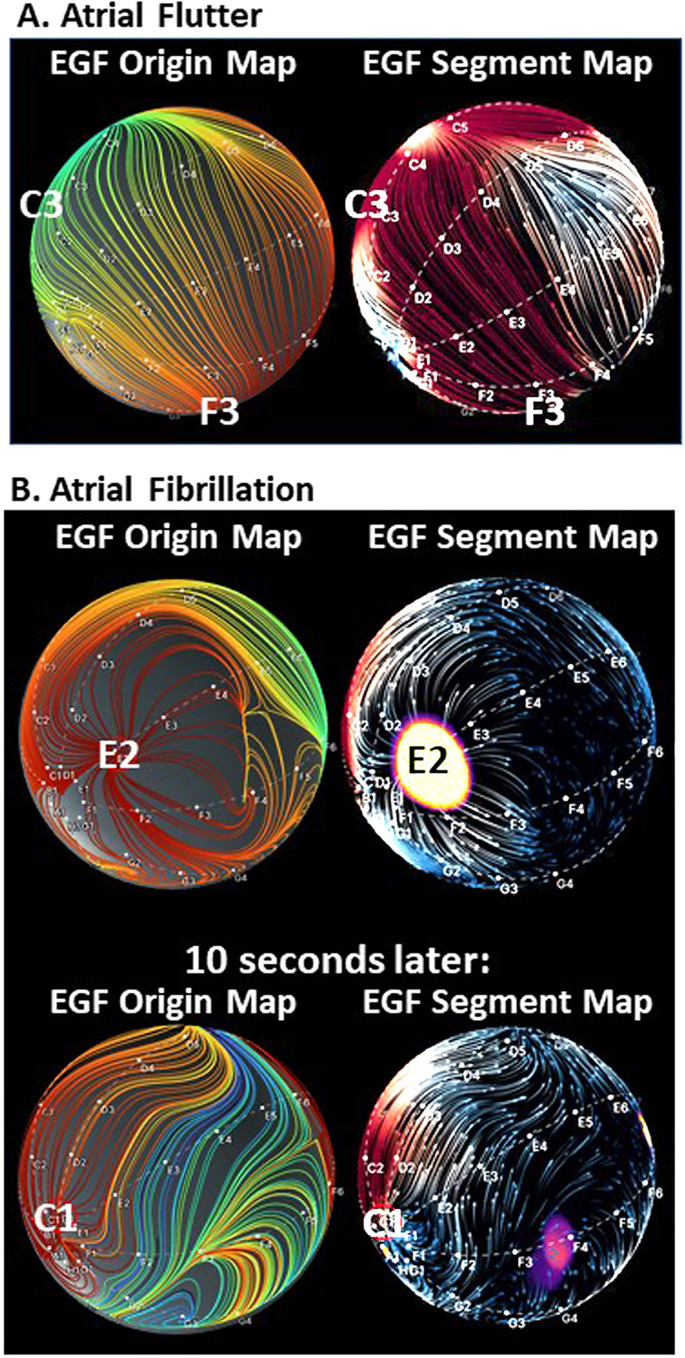
Fig. 4.
Stability of EGF origin in organized atrial arrhythmia versus atrial fibrillation. A 3D EGF Origin Map from 4 s of recording of the atypical atrial flutter shown in Fig. 1C with corresponding EGF Segment Map. B 3D EGF Origin Maps with corresponding EGF Segment Maps during AF show that at one point in time (top map pair), the streamlines originate from E2, while 10 s later the flow arises from C1 (bottom map pair), highlighting the time-dependent electrical behavior of AF (see text)

