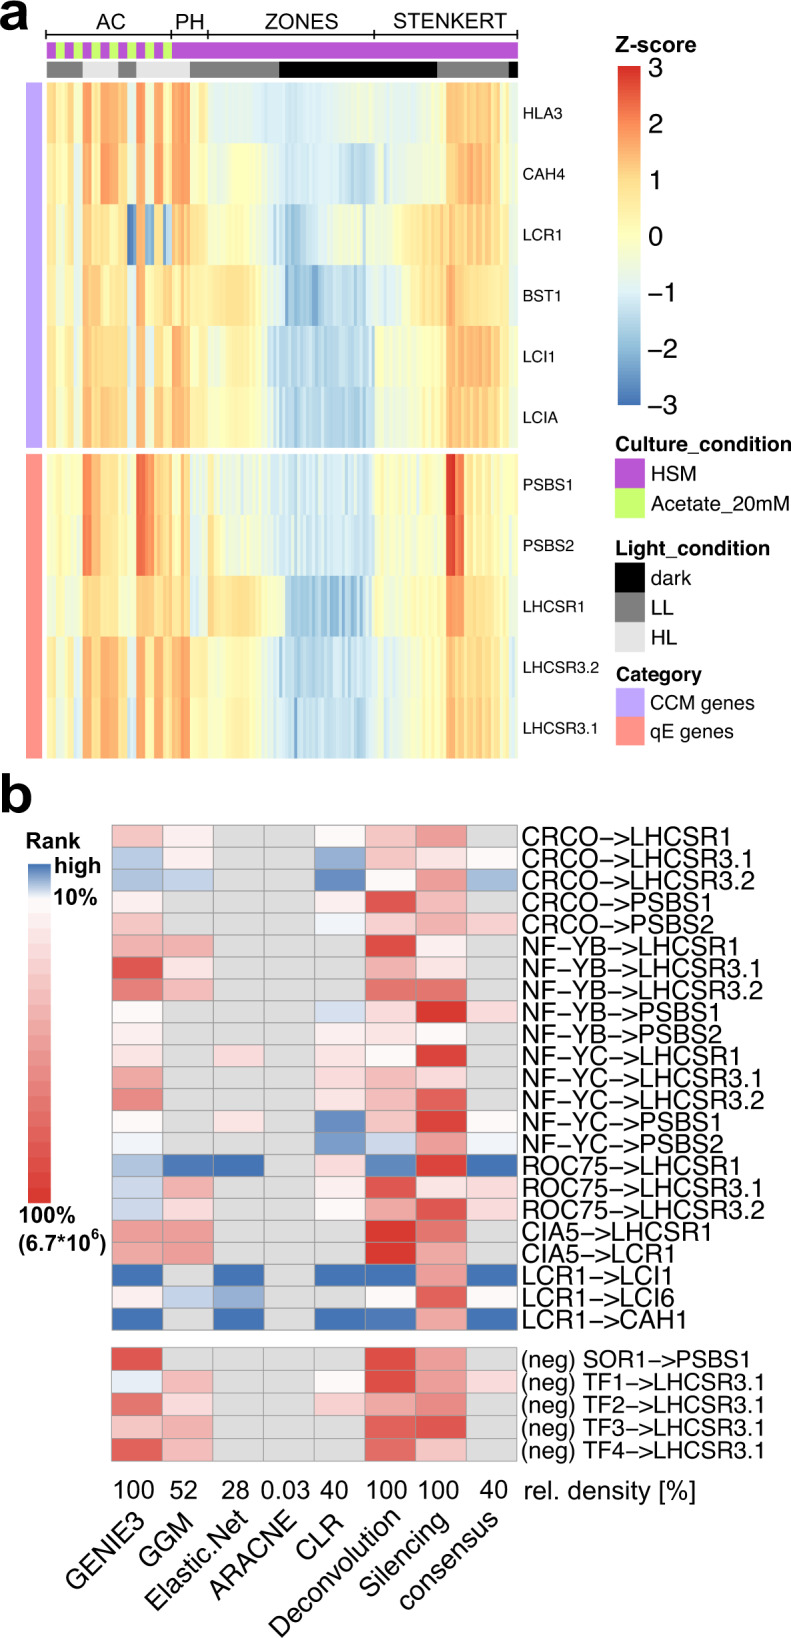
Fig. 1. Characterization of the consensus GRN inferred by employing a compendium of RNAseq data from diverse light and culture conditions.

a Expression levels of representative carbon concentrating mechanism (CCM) and qE genes are plotted over all samples used for network inference (z-scaled log values are depicted, high values red, low values blue). The column annotation gives information on the culture conditions and data set (purple—Sueoka’s high salt medium (HSM), green—HSM + 20 mM acetate, light gray—high light (HL), dark gray—low light (LL), black—no light) see also Supplementary Data 1); no clustering was applied. All experimental conditions have been sampled in biological duplicates or triplicates that are plotted adjacent. Supplementary Fig. 1 shows an enlarged version of this figure with sample names included and biological replicates indicated. b The heatmap rows correspond to experimentally validated or invalidated (neg) gene regulatory interactions involved in qE and CCM, curated from the literature. The heatmap indicates ranking of these interactions by different approaches and the consensus network. Edges are considered highly ranked (depicted in blue) if they are above the 10% network density threshold. Edges ranked below this threshold are depicted in red. Edges that were not included in the given network are marked in gray. At the bottom of the heatmap, the relative number of edges inferred by each approach is provided. ARACNE and Silencing columns were only plotted for comparison and were not used in building the consensus GRN (see Methods). TF1 MYB-like DNA-binding protein, Cre01.g034350; TF2 RWP8, RWP-RK transcription factor, Cre04.g218050; TF3 RWP5, RWP-RK transcription factor, Cre06.g285600; TF4 bHLH domain-containing protein, Cre07.g349152). Source data are provided in the Source Data file.
