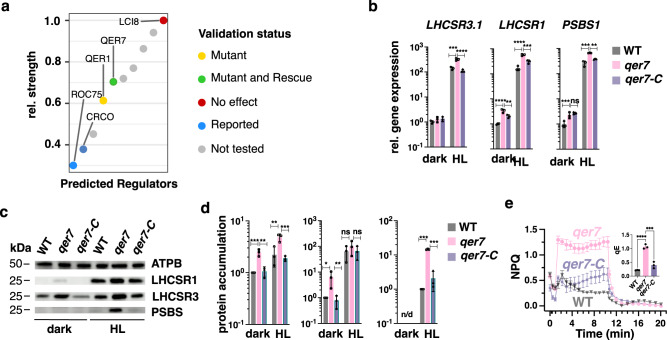
Fig. 3. A PHOT-specific GRN pinpoints QER7 as a suppressor of the expression of qE-related genes.
a Dot plot of the relative regulatory strength of the top 10 regulators of qE-related genes in the PHOT-specific GRN (see Methods). TFs are marked in green if qE transcript levels were affected in the respective knock-out strain and this effect was reversed by complementation with the knocked-out gene, in yellow, if the effect was not reversed by complementation and in red, if no mutant effect was observed in the mutant. TFs for which no mutant lines were available are plotted in gray. b WT, qer7, and qer7-C cells were synchronized under 12 h light (15 µmol m−2 s−1)/12 h dark cycles. After sampling for the dark conditions (end of the dark phase), cells were exposed to 300 µmol photons m−2 s−1 (HL); samples were taken 1 h (RNA) or 4 h (protein and photosynthetic measurements) after exposure to HL. Shown are relative expression levels of qE-related genes at the indicated conditions normalized to WT LL (n = 3 biological samples, mean ± sd). c Immunoblot analyses of LHCSR1, LHCSR3, and ATPB (loading control) of one of the three biological replicate set of samples, under the indicated conditions. d Quantification of immunoblot data of all replicates in c after normalization to ATPB. WT protein levels at HL were set as 1. e NPQ and qE, measured 4 h after exposure to HL (n = 3 biological samples, mean ± sd). b, d, e The two-sided p values for the comparisons are based on ANOVA Dunnett’s multiple comparisons test and are indicated in the graphs (*P < 0.005, **P < 0.01, ***P < 0.001, ****P < 0.0001). Statistical analyses for b and d were applied on log10-transformed values. The exact p values are shown in the Source Data file.

