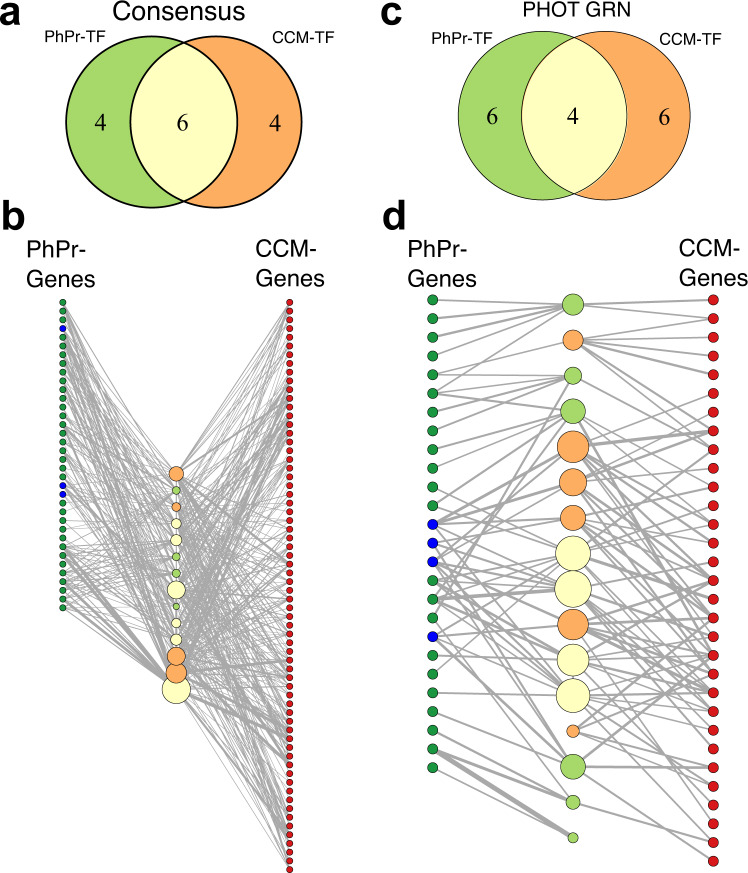
Fig. 5. Consensus and PHOT-specific GRNs indicate extensive co-regulation of CCM and photoprotective genes.
Top: Venn diagram depicting the overlap of the top 10 predicted TFs of the curated CCM and photoprotective (PhPr) genes based on a the consensus or c PHOT-specific GRN. Bottom: Network representation of the top ten TF sets of b the consensus network or d the PHOT-specific GRN (center nodes, same color code as in a) and the target genes used for prediction (left and right columns of nodes, photoprotection genes are shown in green, qE-related genes in blue, and CCM genes in red. b The plotted regulatory strength corresponds to , in d, it corresponds the GENIE3 edge weights denoting random forest importance measure. The edge width is proportional to the strength of the specific regulatory interaction. The size of the TF nodes corresponds to the sum of all plotted target gene edge weights.

