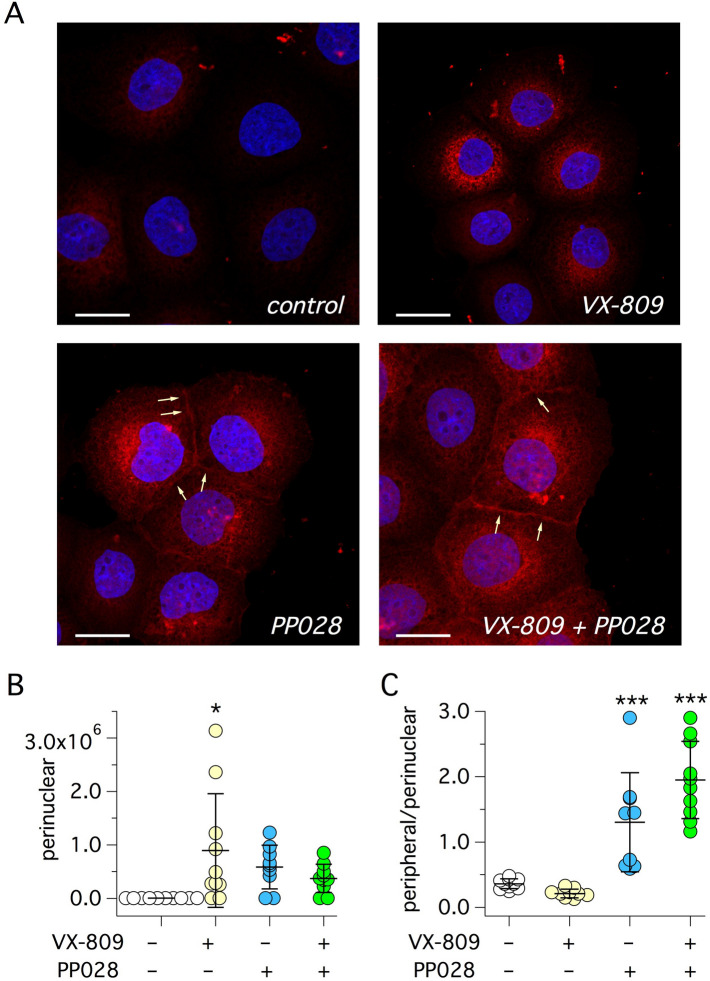
Figure 5.
Detection of CFTR protein by immunofluorescence. (A) Representative images showing immunofluorescence detection of CFTR (red) in CFBE41o- cells expressing F508del-CFTR after 24 h treatment with vehicle (control), 1 µM VX-809, 10 µM PP028, and 1 µM VX-809 plus 10 µM PP028. Arrows show F508del-CFTR signal at the plasma membrane. Scale bar: 20 µm. (B) Intensity of CFTR signal in the perinuclear region of cells treated with indicated compounds. (C) Ratio of CFTR intensity signal in the peripheral and perinuclear regions. *, p < 0.05; ***, p < 0.001; vs. vehicle (ANOVA with Tukey’s post-hoc test).

