Figure 7.
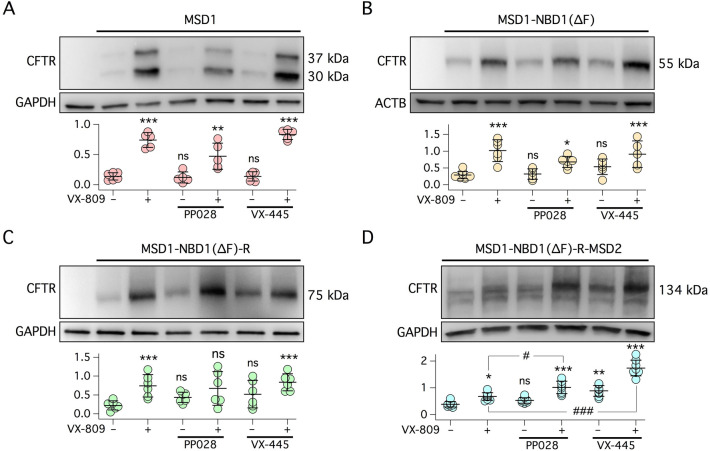
Stabilization of CFTR fragments by CFTR correctors. Each panel shows immunoblot analysis of cells transfected with MSD1 (A), MSD1-NBD1(∆F) (B), MSD1-NBD1(∆F)-R (C), and MSD1-NBD1(∆F)-R-MSD2 (D). Cells were incubated for 24 h with: vehicle, 1 µM VX-809, 10 µM PP028, or 5 µM VX-445, as single agents or as combinations. Scatter dot plots show densitometric analysis of CFTR fragments. For panel A, the upper band (37 kDa) was considered for analysis. Data report the ratio of CFTR fragment intensity to GAPDH or beta-actin (ACTB) band intensity. *, p < 0.05; **, p < 0.01; ***, p < 0.001; ns, not significant vs. vehicle. #, p < 0.05; ###, p < 0.001 vs. VX-809 (ANOVA with Tukey’s post-hoc test).

