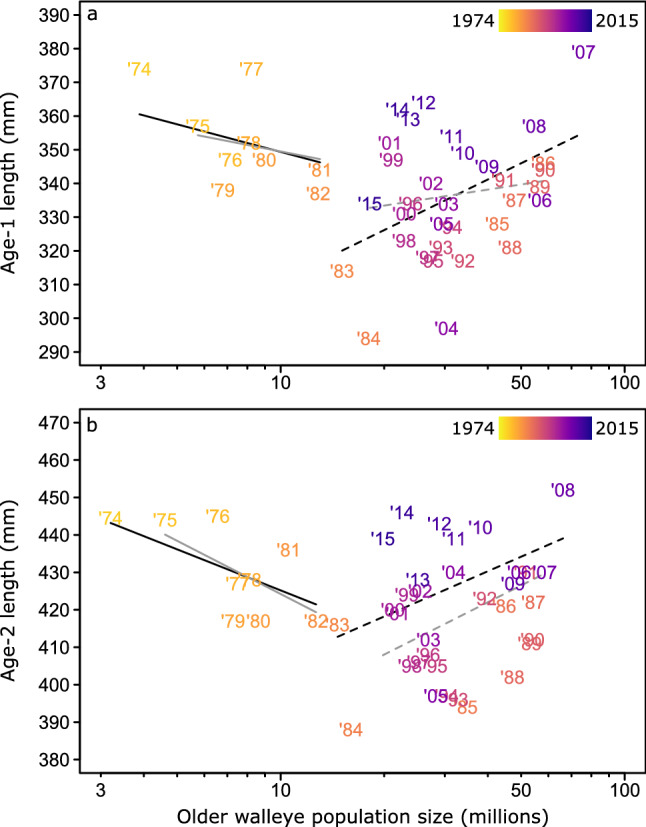
Figure 5.

Relationships between the mean total length of (a) age-1 and (b) age-2 walleye and the estimated total number of older (age 3 +) walleye in Lake Erie during 1974–2015. Years progress across a color gradient from yellow to blue, with orange and purple representing intermediate decades. Solid lines indicate the best pre-breakpoint relationships, whereas dashed lines represent post-breakpoint relationships (modeled using piecewise linear regression). Gray lines show relationships with a downweighted influence of potentially high leverage points (age-1: 1974, 1983, 1984, and 2007; age-2: 1974, 1983, 1984, and 2008). Relationships were initially negative (age-1: slope = − 51.2, R2lik = 0.37, P = 0.041; age-2: slope = − 42.0, R2lik = 0.36, P = 0.046), but switched to positive after the breakpoint (age-1: slope = 52.2, R2lik = 0.13, P = 0.028; age-2: slope = 46.4, R2lik = 0.12, P = 0.042). Note the log-scale on the x-axis.
