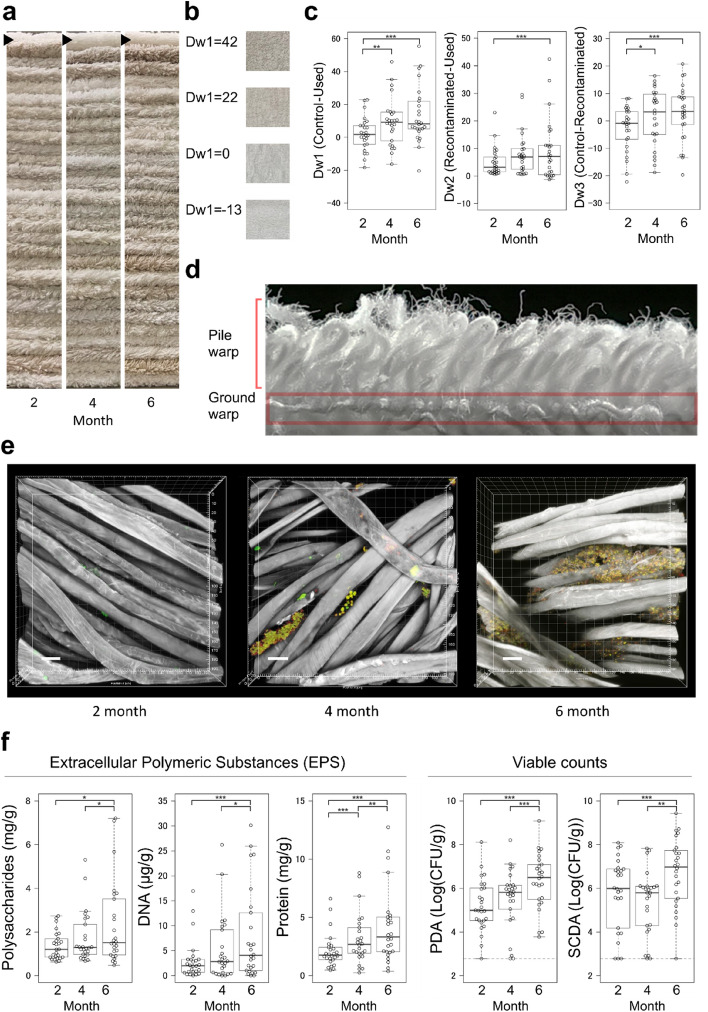
Figure 2.
Changes in dullness and biofilm components of the used towels. (a) Images of the collected towels that were used for 2, 4, and 6 months. The towels were stacked and arranged by collected months. Arrowheads indicate towels that were not used or washed. (b) Various Dw1 values (differences in whiteness between new and used towels) and the corresponding towel images. (c) Difference in whiteness compared using various scales. Dw2; differences in whiteness between washed-only (recontaminated) and used-washed (used) towels. Dw3; differences in whiteness between new (control) and washed-only (recontaminated) towels. Larger Dw values indicate increased dullness. (d) Image of the cut surface of the towel was captured from the side using a digital camera. The pile warp covers the ground warp from both sides. The image shows the pile and ground warps on one side. The red square shows the area where biofilm formed. (e) Confocal microscope images of collected towels from household D. Green: live cells stained with carboxyfluorescein succinimidyl ester (CFSE); red: dead cells stained with propidium iodide (PI); and white: β1,3-,1,4-glucans stained with calcofluor white. Scale bar, 20 µm. (f) Comparative analysis of biofilm components. Each quantitative value indicates analyte per gram of towel. The dashed lines on the colony-forming unit (CFU) plots indicate the lower limit of detection (2.78 Log(CFU/g)). *p < 0.05, **p < 0.01, and ***p < 0.001.

