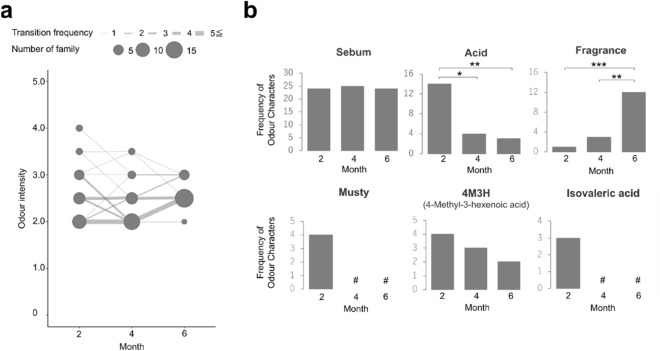
Figure 3.
Changes in odour intensity and frequency of each odour type in the used towels. (a) Changes in odour intensity in the used towels. Circle size and line width indicate the number of the used towels, and lines indicate the progression of odour intensity of the towels at each time point, from 2 to 4 months and from 4 to 6 months within each household. (b) Frequencies of detected odour types. *p < 0.05, **p < 0.01, ***p < 0.001, and # not detected.

