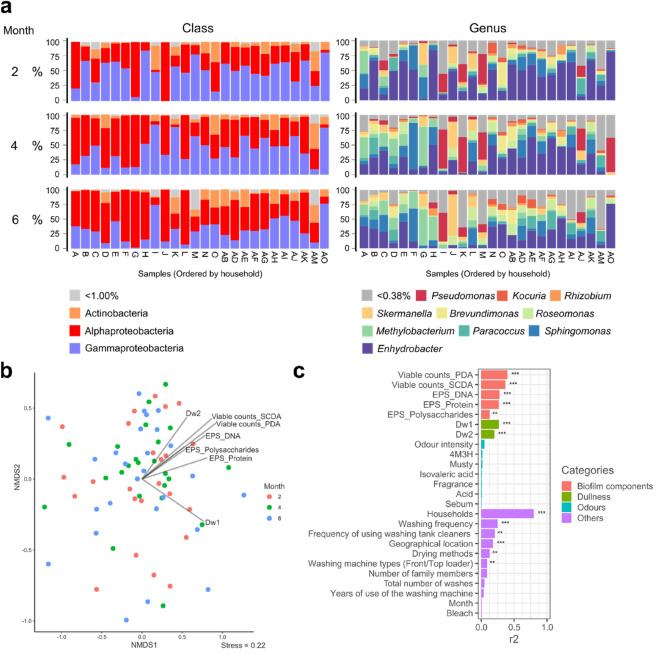
Figure 4.
Microbiota in the used towels and the association with various metadata. (a) Microbiota in the used towels. Each bar displays the relative abundance of species at class (left) and genus (right) levels. Species with high median relative abundances (left: > 1%, right: > 0.38%) are shown as coloured bars. The remaining species (left: median relative abundance < 1%, right: median relative abundance < 0.38%) are shown as a single grey bar. (b) NMDS and envfit results. Seventy-one sample plots are ordinated in NMDS space based on Bray–Curtis dissimilarities calculated from operational taxonomic unit abundance tables. Vectors with significant correlations (p < 0.001) are fitted using envfit and the length of the arrow is proportional to the strengths of the correlations. (c) Variance (r2) explained by each covariate in the model determined by envfit. Covariates are coloured based on the metadata category. *p < 0.05, **p < 0.01, and ***p < 0.001.

