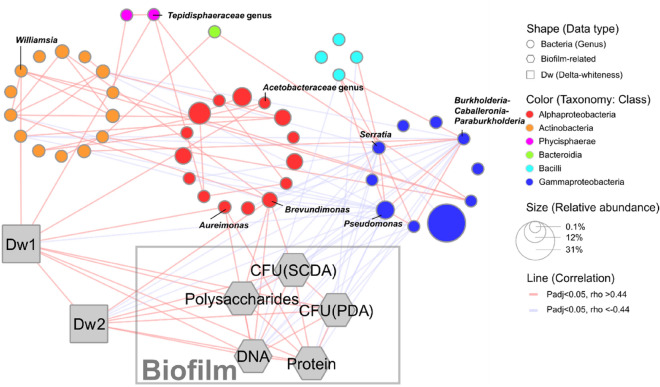
Figure 5.
Network analysis of bacterial species, dullness, and biofilm components. The nodes indicate genera with mean relative abundance ≥ 0.1% and associated metadata. The node shape indicates the data type. Circles indicate genera, which are coloured by their class, and the size indicates the relative abundance. Lines indicate correlations (p < 0.05). Red and blue lines indicate positive and negative correlations, respectively. Grey hexagons indicate the biofilm components and grey squares indicate the Δ whiteness (Dw) value.

