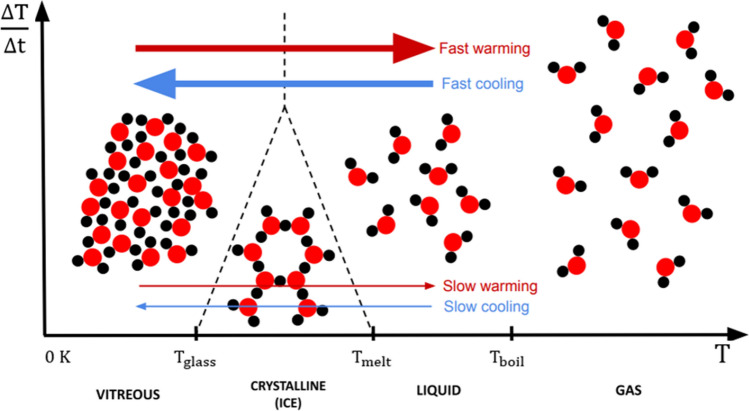
Figure 1.
Effects of cooling and warming rates on the phase change for an aqueous system. The horizontal axis represents the temperature in Kelvin, with the transition temperatures between the four states (glass, crystal, liquid, and gas) labeled as and Tglass (glass transition temperature), Tmelt (melting temperature) and Tboil (vaporization temperature). This axis can be traversed in both directions, corresponding to the changes of state when crossing the marked temperatures. The vertical axis represents the speed at which the temperature change occurs. The arrangement of the molecules of the system for the four mentioned states are represented in an illustrative manner. In this diagram, the speed at which it crosses through the marked temperatures is of special interest, the most relevant for the topic that concerns us being the change from liquid to glassy state. An excessively slow temperature change (low values on the vertical axis) to go from the liquid to the glassy phase, and vice versa, implies the necessary passage through the crystalline phase, which in aqueous systems implies the formation of ice. Instead, high cooling and/or warming rates (high values on the vertical axis) bypass the "crystalline" region, giving a direct change between the liquid and glassy states.

