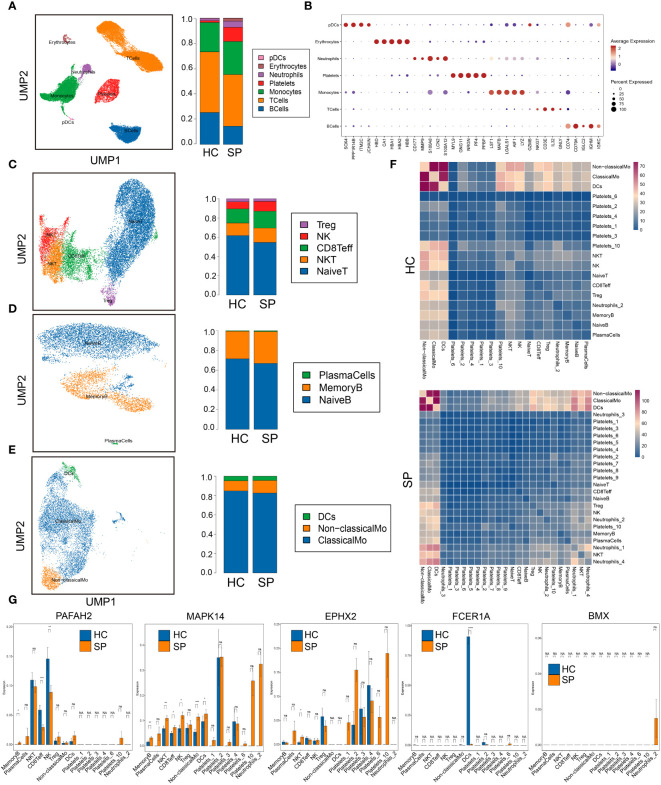
Figure 5.
Single-cell gene expression analysis of peripheral blood mononuclear cells (PBMC) in sepsis. (A) UMAP plot of the cell clusters annotated by the SingleR package. (B) Bubble chart of the top five markers of each cluster. (C) Subclusters of T cells. (D) Subclusters of B cells. (E) Subclusters of monocytes. (F) Heatmaps of number of ligand-receptor pairs across cell subgroups in HC and SP. (G) The expressions of the 5 hub genes in each subclusters. *: as compared with the Control group, P <0.05; **: as compared with the Control group, P <0.01; ***: as compared with the Control group, P<0.001; ****: as compared with the Control group, P<0.0001. ns: as compared with the Control group, no significant difference. NA: Not available.

