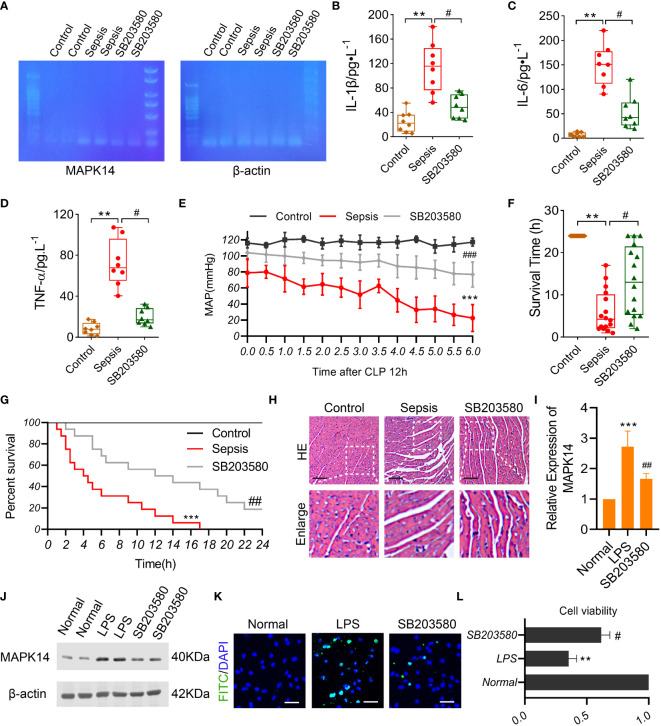
Figure 8.
The role of MAPK14 in sepsis rats and LPS-induced cardiomyocytes. (A) RT-PCR detecting the inhibitory effectiveness of SB203580 on MAPK14 in heart tissues. ELISA showing the levels of (B) IL-1β, (C) IL-6, and (D) TNF-α between three groups. (E) MAP within 6h detecting starting at 12h after CLP. (F) The survival time and (G) rate of rats. (H) Representative HE staining images of myocardial fibers. (I) Quantification of Western blotting results of MAPK14. (J) Representative Western blotting images of MAPK14. (K) Representative TUNEL staining images of H9C2 cells. (L) CCK-8 detecting the cell viability of H9C2 cells. **: as compared with the Control or Normal group, P< 0.01; ***: as compared with the Control or Normal group, P< 0.001; #: as compared with the Sepsis or LPS group, P< 0.05; ##: as compared with the Sepsis or LPS group, P< 0.01.

