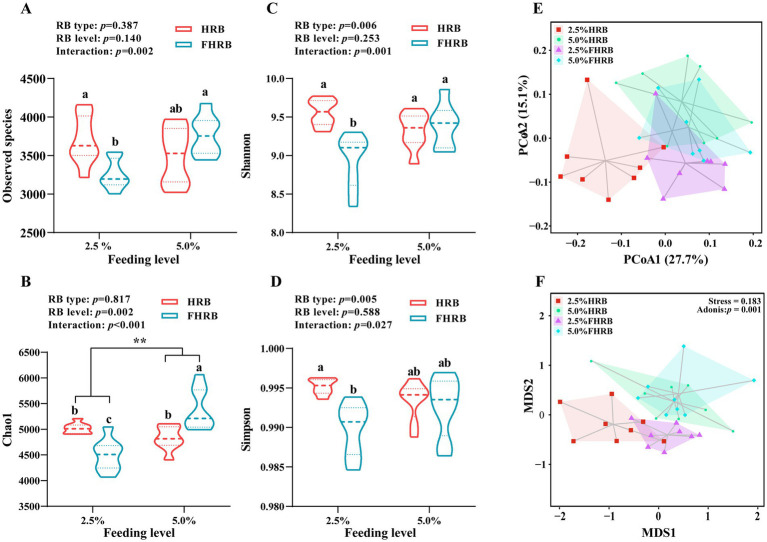
Figure 1.
Effects of RB type and feeding level on the cecal microbial diversity in laying hens. (A–D, alpha diversity; E,F, beta diversity). (A) Observed species. (B) Chao1. (C) Shannon. (D) Simpson. (E) Principal coordinate analysis (PCoA). (F) NMDS analysis. All values are expressed as the means with standard (n = 8). p < 0.05 indicates that the main effect and interaction have significant differences. * and ** indicate significant (p < 0.05) and highly significant (p < 0.01) differences at feeding level, respectively. Based on interaction p < 0.05, a–c values with different letters are significantly different at p < 0.05.

