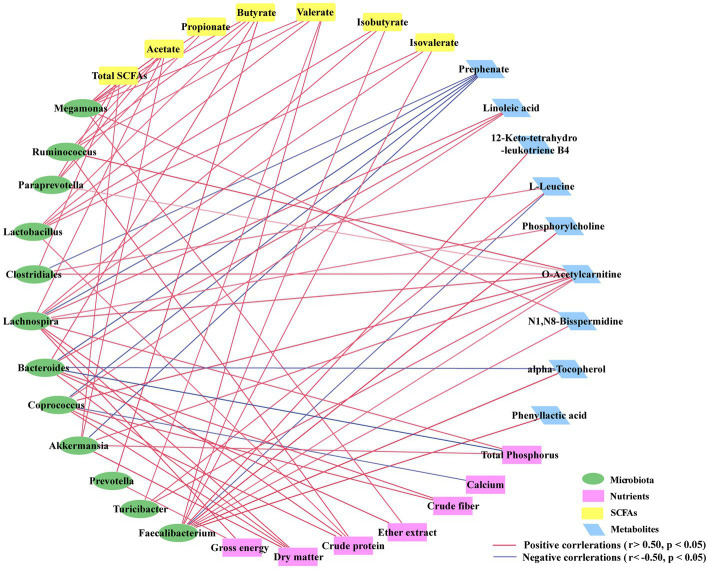
Figure 5.
Correlation network analysis among the cecal microbiota (at the genus level), differentially expressed metabolites and apparent digestibility of nutrients. Each line has an absolute Spearman rank correlation; red lines represent positive correlations (r > 0.50, p < 0.05), and blue lines represent negative correlations (r < −0.50, p < 0.05).

