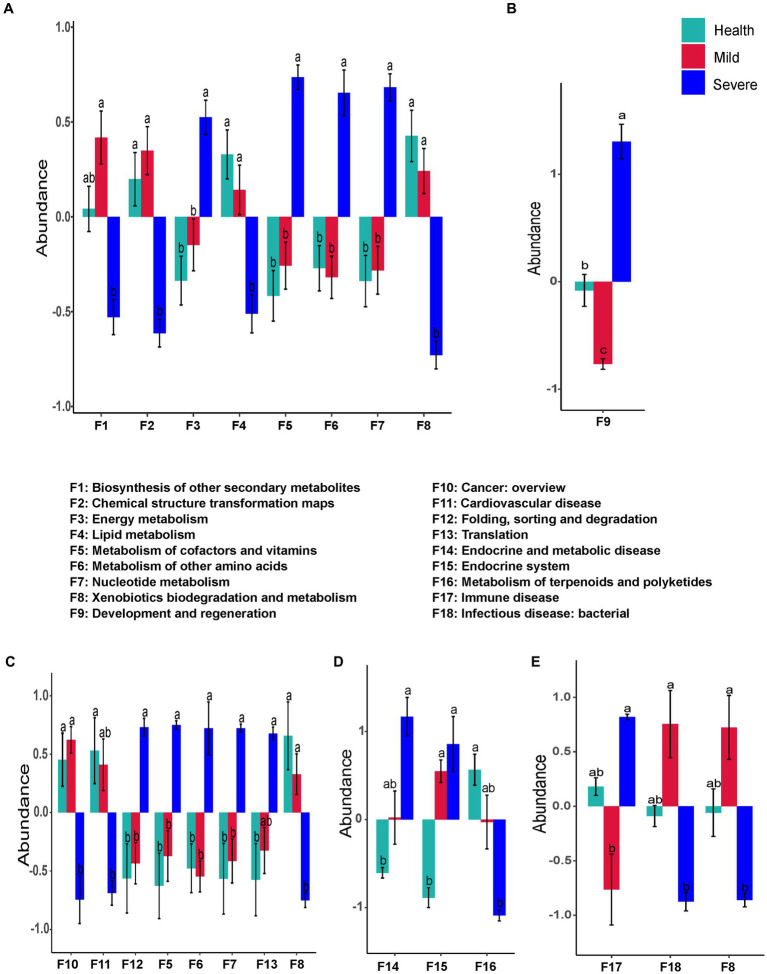
Figure 6.
The bacteria flora predicted functions that had a significant difference between groups. (A) Total samples from all sampling sites; (B) samples from the forehead; (C) samples from the cheek; (D) samples from the chin; (E) samples from check and back. The different alphabet on the column represented there was a significant difference between groups.

