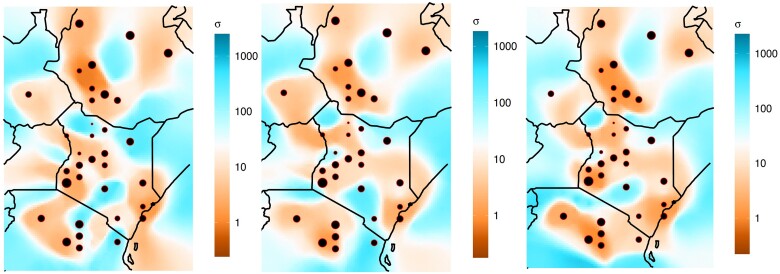
Fig. 3.
Inferred dispersal surfaces based on shared IBD tracts using the program MAPS (Al-Asadi et al. 2019). Time intervals correspond to approximately 56 generations ago (left), approximately 31 generations ago 165 (middle), and approximately 13 generations ago (right). Light blue shows higher migration and brown shows lower migration. For the purpose of visualization, MAPS transforms the symmetric migration rate (m) into dispersal distance (σ) by scaling with the grid step-size (Al-Asadi et al. 2019). Dispersal distance is an “effective spatial diffusion parameter, often referred to as the ‘root mean square dispersal distance’, which can be interpreted roughly as the expected distance an individual disperses in one generation” (Al-Asadi et al. 2019). The size of each circle is proportional to the number of genetic samples.

