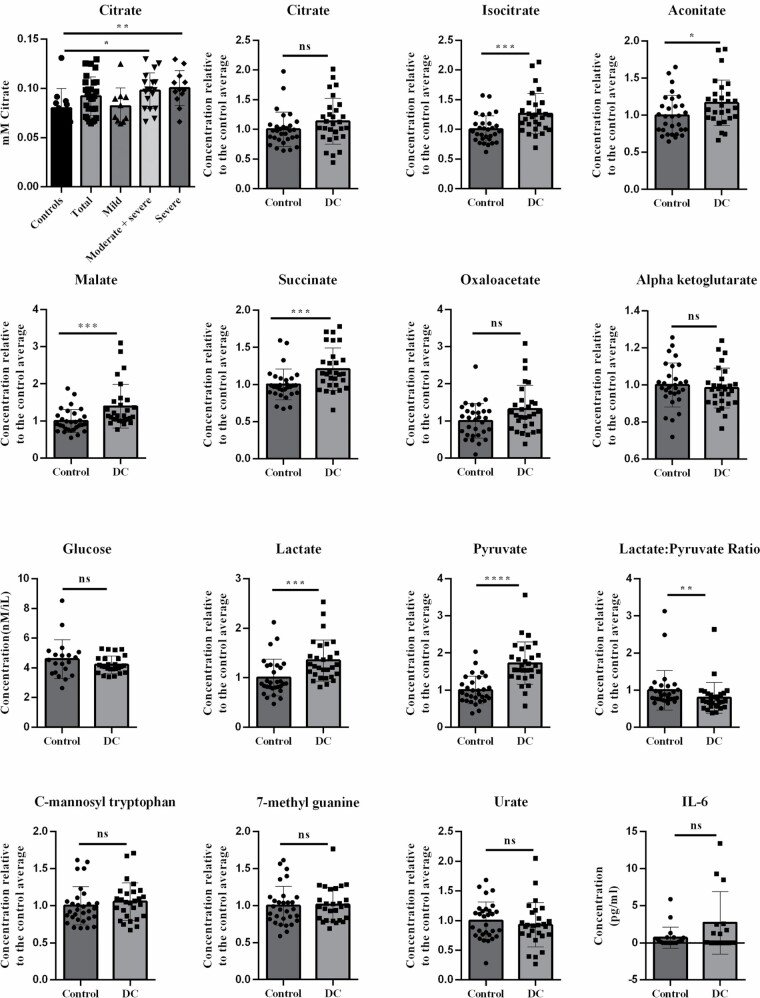
Figure 2.
Citrate, glucose, IL-6, and normalized metabolite levels in DC patient and control subject plasma. The far left-hand panel in the top row shows citrate levels in DC (n = 28) and normal control (n = 12) subjects as assessed by GC-MS. DC patients with mild aplastic anemia (0–1 abnormal clinical indicators n = 10), severe (3–4 clinical indicators, n = 12), or a combination of severe and moderate (2–4 clinical indicators, n = 18) are also shown to assess the effect of aplastic anemia on disease severity. Each point represents the average between 1 and 3 determinations all performed at the same time. Glucose levels are in mM in a subset of the DC patients (n = 26) and control subjects (n = 20). IL-6 levels are in pg/mL in a subset of the DC patients (n = 15) and control subjects (n = 21). All remaining panels show the LC-MS metabolite levels normalized to the average of the control subject levels in DC (n = 29) and control (n = 30). All p values were determined by the Wilcoxon–Mann–Whitney rank test and/or Welch’s test and both methods gave the similar p values. DC = dyskeratosis congenita; GC-MS = gas chromatography/mass spectrometry; IL-6 = interleukin-6; LC-MS = liquid chromatography/mass spectrometry.

