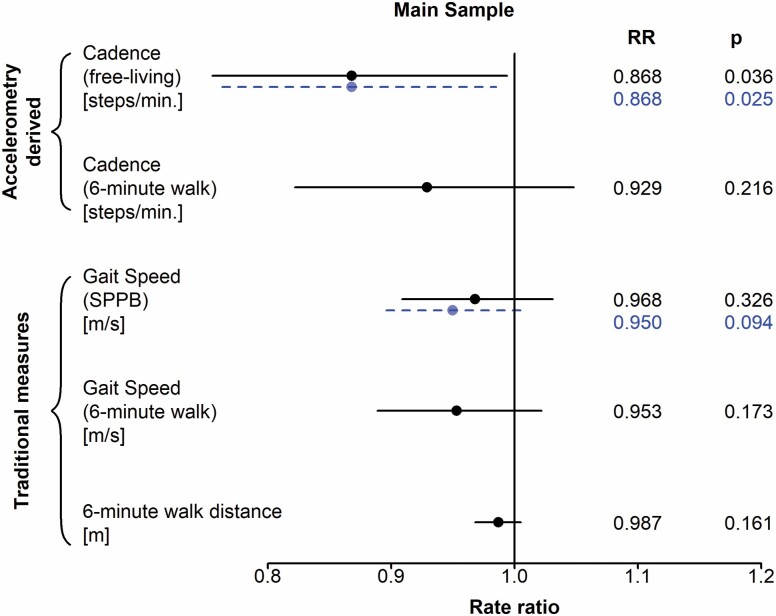
Figure 1.
Forest plot depicting rates of falls by separate characteristics of gait cadence, speed, and distance. The solid line represents the main sample consisting only of participants who attempted the 6-minute walk (N = 394). The dashed line represents the expanded sample consisting of all participants with valid accelerometry measurements (N = 432). SPPB = Short Physical Performance Battery.

